Micro Bioreactor Market Overview
Global Micro Bioreactor Market reached USD 3.5 billion in 2022 and is expected to reach USD 7.2 billion by 2031 growing with a CAGR of 9.8% during the forecast period 2024-2031. A microbioreactor is a small-scale bioreactor system used to cultivate and study microorganisms, cells, or tissue in a controlled laboratory setting.
It is an atomic interpretation of the traditional bioreactor that allows researchers to conduct trials on a smaller scale and with less volume. Micro bioreactors are employed in many fields, including pharmaceutical research, biotechnology, bioengineering, and academic research. They're utilized in cell culture, stem cell research, drug development, and operation optimization, among other things.
Furthermore, the advancements in biotechnology and biopharmaceutical research, growing focus on process optimization and quality control, and rising demand for high-throughput screening are the factors expected to drive the market over the forecast period.
Market Summary
| Metrics | Details |
| CAGR | 9.8 % |
| Size Available for Years | 2022-2031 |
| Forecast Period | 2024-2031 |
| Data Availability | Value (US$) |
| Segments Covered | Type, Application, Region |
| Regions Covered | North America, Europe, Asia-Pacific, South America, and Middle East & Africa |
| Fastest Growing Region | Asia-Pacific |
| Largest Region | North America |
| Report Insights Covered | Competitive Landscape Analysis, Company Profile Analysis, Market Size, Share, Growth, Demand, Recent Developments, Mergers and Acquisitions, New Product Launches, Growth Strategies, Revenue Analysis, Porter’s Analysis, Pricing Analysis, Regulatory Analysis, Supply-Chain Analysis, and Orthopedic Surgery key Insights. |
For more details on this report – Request for Sample
Market Dynamics
Developing the Next Generation of Microbioreactor Systems by Market Players is Expected to Drive Market Growth.
M2p-labs BioLector XT high-throughput microbioreactor enables real-time evaluation of biomass, fluorescence, pH, DO, and other key cultivation parameters for aerobes and anaerobes to quickly provide deep insights into bioprocess development. The BioLector XT micro bioreactor, based on trusted BioLector Pro technology, is based on a standard ANSI/SLAS (SBS) microtiter plate (MTP) format and operates with online, pre-calibrated optical sensors.
Disposable 48-well MTPs allow for real-time measurement of biomass, fluorescences, pH, and DO, while patented microfluidic technology allows for simultaneous pH control and feeding. The optional microfluidic module eliminates the need for manual liquid handling, as everything is included in the gamma-radiated ready-to-use plate.
Furthermore, it can fully customize cultivation protocols to cover a broader range of applications, and it allows for the free combination of different feeding and pH control strategies within a single cultivation run. The updated BioLection software features an intuitive user interface designed for multi-user environments, a new gassing lid that reduces gas consumption and acts as an air-tight anaerobic chamber that can be used with the microfluidic module, eliminating the need for anaerobic tents, and actively regulated O2 or CO2 concentration of ingoing gas can be increased to 100% or 12%, respectively.
Thus, owing to the above factors, the market is expected to drive over the forecast period.
Advancements in Cell Culture Technology are Expected to Drive the Market Growth
Advances in cell culture technology have a significant impact on researchers' and scientists' abandonment of micro bioreactors. These advances have resulted in the development of advanced methods and tools for studying cells in a controlled environment, resulting in more accurate and effective cell culture systems.
For instance, advances in 3D cell culture systems have resulted in several instigative developments that improve the generation of further harmonious and physiologically applicable 3D cell cultures. Synthetic hydrogels are being used to create more harmonious 3D cell cultures by providing a persuasive matrix for cells to grow and interact in, mimicking the natural extracellular matrix.
Synthetic hydrogels are well-suited for 3D cell culture because they are analogous to the natural extracellular matrix. They can be designed as an artificial extracellular matrix altar to provide spatial exposure while also promoting cellular interactions with their surroundings.
Furthermore, synthetic hydrogels enable the creation of more consistent 3D cell cultures when compared to traditional methods. They have well-defined chemical and physical properties, such as stiffness, porosity, and adhesive moieties, that can be tuned to meet specific requirements. Micro bioreactors provide the necessary control and reproducibility to ensure consistent and standardized growth conditions in these synthetic hydrogel scaffolds.
The demand for micro bioreactors will increase as researchers seek reliable and reproducible platforms for 3D cell culture experiments. Thus, owing to the above factors, the market is expected to drive over the forecast period.
High Cost for Setting of Micro Bioreactors is Expected to Hamper the Market Growth
Acquiring and installing micro bioreactors can be expensive, especially for advanced and technologically complex systems. The high initial investment required to establish micro bioreactor installations can be a challenge for small research laboratories and associations with limited financial resources. For instance, The ambr 15 cell culture system is a micro bioreactor system offered by Sartorius AG. The approximate cost for an ambr 15 system is around $300,000 to $400,000, which includes the base system and some additional modules.
Market Segmentation Analysis
The global micro bioreactor market is segmented based on type, application, and region.
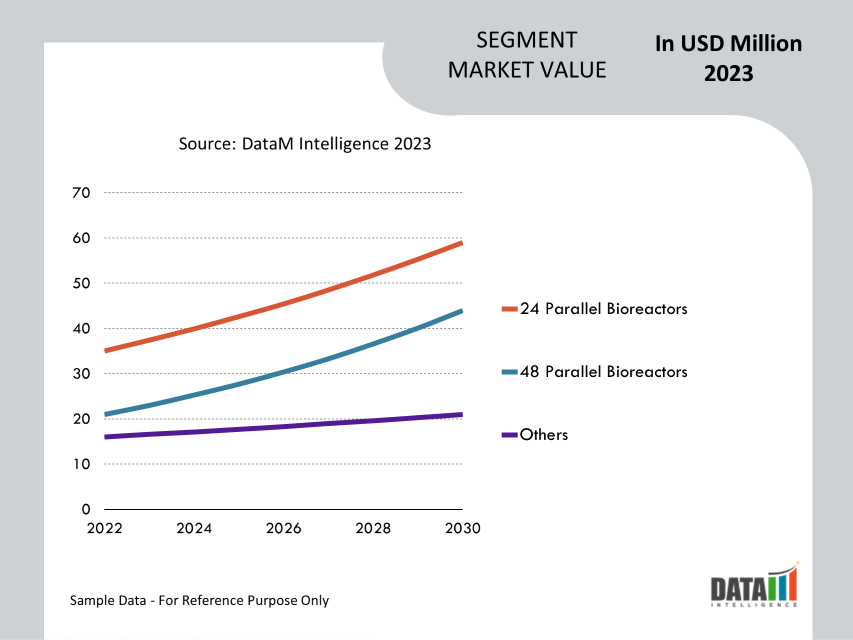
Owing to the Greater Flexibility, Cost Effective, Ease of Management, and Advancement in the Equipment, the Type Segment Accounted for Approximately 33.5% of the Micro Bioreactor Market Share
24 Parallel Bioreactors refers to a setup conforming to 24 individual bioreactors that can operate contemporaneously. Each bioreactor provides a controlled terrain for the growth and civilization of natural organisms similar to cells or microorganisms.
The advantage of such a system lies in its capability to conduct multiple trials or processes in parallel, enhancing effectiveness and productivity. Experimenters can contemporaneously test different parameters, similar as temperature, pH, nutrient attention, or other variables, allowing for an advanced outturn of trials and the capability to compare results more effectively. This resemblant approach accelerates exploration and development processes in various fields, including pharmaceuticals, biotechnology, and industrial operations.
For instance, Pall Corporation provides bioreactor systems, including parallel bioreactor solutions. Their Allegro XRS 25 Bioreactor System offers 24 parallel bioreactors with single-use vessels for increased throughput and process development efficiency.
Furthermore, the ambr 250 High Throughput Bioreactor System is a sophisticated and automated similar bioreactor system designed for increased productivity and effectiveness in bioprocess development. It was created specifically for biopharmaceutical sedulity operations.
The system is made up of multiple individual bioreactors, typically 24 in number, that run at the same time. Each bioreactor is a miniature vessel that provides a controlled environment for cell or microorganism civilization. These bioreactors are typically single-use, which eliminates the need for time-consuming cleaning and sterilization processes between trials.
Also, the ambr 250 system includes advanced automation and monitoring capabilities. It enables researchers to independently control and adjust various parameters such as temperature, pH, dissolved oxygen, and agitation speed in each bioreactor. This rigor allows for similar trials with different conditions, allowing for optimization and process parameter netting.
One significant advantage of the ambr 250 system is its high output capability. Researchers can conduct more trials in less time by running multiple bioreactors at the same time. This accelerated trial allows for rapid process development, optimization, and condition netting, ultimately leading to increased productivity and reduced time to sell biopharmaceutical products. Thus, owing to the above factors, the market segment accounted to hold the largest market share over the forecast period.
Market Geographical Share
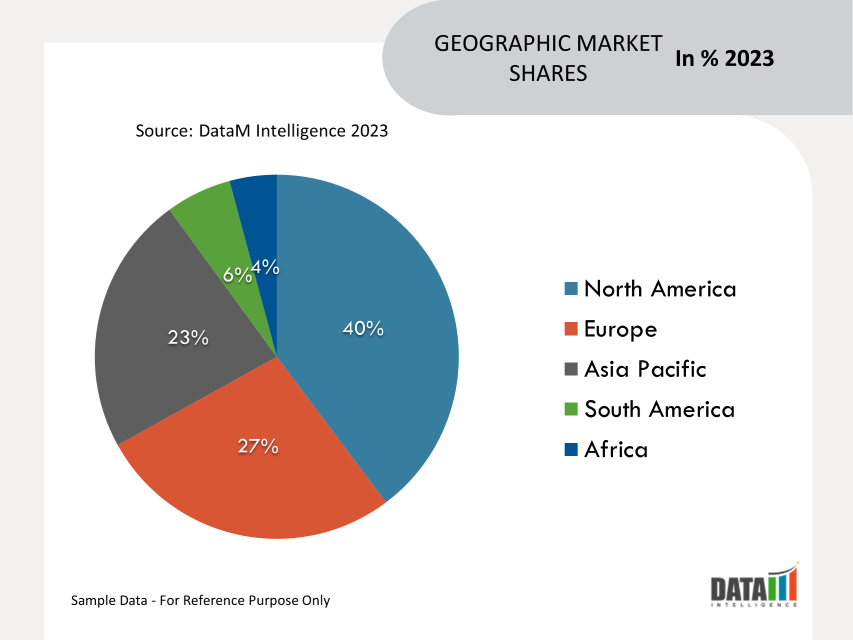
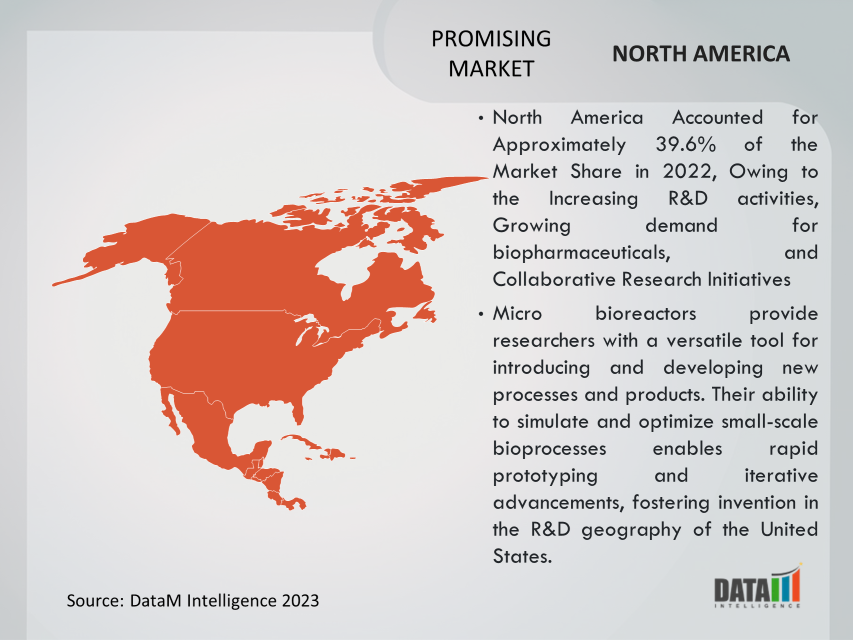
North America Accounted for Approximately 39.6% of the Market Share in 2022, Owing to the Increasing R&D activities, Growing demand for biopharmaceuticals, and Collaborative Research Initiatives
The United States has a highly competitive discourse geography, with academic institutions, biotech companies, and pharmaceutical giants constantly pushing the boundaries of scientific discovery.
For example, Amgen is a global biopharmaceutical company that focuses on developing new treatments for serious diseases. Micro bioreactors are commonly used in their bioprocessing workflows to optimize and accelerate cell line development and biologics product development.
Similarly, Pfizer is one of the world's largest pharmaceutical companies, developing and manufacturing a wide range of pharmaceutical products. They used micro bioreactors for process development and high-throughput screening, which allowed for effective product parameter optimization and rapid evaluation of seeking molecules.
Therefore, micro bioreactors provide researchers with a versatile tool for introducing and developing new processes and products. Their ability to simulate and optimize small-scale bioprocesses enables rapid prototyping and iterative advancements, fostering invention in the R&D geography of the United States.
Thus, owing to the above factors, the North American region is expected to hold the largest market share over the forecast period.
Market Key Players
The major global players in the market include Sartorius, Stedim, Pall Corporation, M2p-labs, Merck, Applikon Biotechnology, Chemtrix, CerCell, RUAG Space Nyon, PreSens Precision Sensing, and Eppendorf among others.
COVID-19 Impact on Market
COVID-19 has positively impacted the global micro bioreactor market. The urgent global need for COVID-19 vaccines has resulted in significant investment in research and development. Micro bioreactors have played a critical role in the rapid development and production of vaccines, allowing for effective process optimization and high-output vaccine campaigners.
This increased demand for vaccine development has positively influenced the demand for micro bioreactors. The outbreak highlighted the importance of quick and scalable bioprocessing technologies. Micro bioreactors have been recognized as valuable tools in biopharmaceutical assiduity due to their small-scale and automated capabilities. The demand for micro bioreactors and related technologies has increased as a result of the need for rapid process development and manufacturing inflexibility.
Russia Ukraine Conflict Analysis
The ongoing conflict between Russia and Ukraine has the potential to impact the micro bioreactor market. The conflict could hinder cross-border scientific collaborations. The defection of new technologies, including micro bioreactors, is frequently driven by cooperative exploration efforts. However, if these collaborations disintegrate or are put on hold due to the conflict, it may slow down the relinquishment and application of micro bioreactors in the affected regions.
Priorities for exploration may shift during times of conflict to address immediate challenges and philanthropic needs. Funding and coffers that would have been allocated to scientific research, including biotechnology and medicine, could be diverted to dealing with the aftermath of the conflict. This shift in exploration priorities may have an immediate impact on demand for micro bioreactors and overall demand growth.
Key Developments
- On October 15, 2022, CYTENA GmbH launched the C.NEST a robust, flexible & reliable system for everyday culturing. The C.NEST microbioreactor provides outstanding flexibility in static and mixing culture conditions and supports superior cell growth and maintenance of a variety of cell lines and mammalian cells with customizable mixing levels, independent control of environmental settings, and customization of capacity for personalized solutions.
- On December 6, 2022, Merck, a leading science and technology company, acquired Massachusetts-based Erbi Biosystems, a developer of the 2 ml micro-bioreactor platform technology, known as the Breez. The deal strengthens Merck’s upstream portfolio in therapeutic proteins by enabling scalable cell-based perfusion bioreactor processes from 2ml to 2000L with rapid lab-scale process development. It also offers future development opportunities in novel modality applications, including cell therapies.
Why Purchase the Report?
- To visualize the global micro bioreactor market segmentation based on type, application, and region, as well as understand key commercial assets and players.
- Identify commercial opportunities by analyzing trends and co-development.
- Excel data sheet with numerous data points of global micro bioreactor market-level with all segments.
- PDF report consists of a comprehensive analysis after exhaustive qualitative interviews and an in-depth study.
- Product mapping available as Excel consisting of key products of all the major players.
The global micro bioreactor market report would provide approximately 53 tables, 50 figures, and 195 Pages.
Target Audience 2024
- Manufacturers/ Buyers
- Industry Investors/Investment Bankers
- Research Professionals
- Emerging Companies