Immuno-Oncology Assays Market Overview
Immuno-oncology assays are diagnostic tools that analyze immune responses and biomarkers to guide and monitor cancer immunotherapies.
The Immuno-oncology assays market is experiencing rapid growth, driven by the rising global cancer burden and increasing adoption of personalized medicine. These assays play a critical role in identifying and validating predictive biomarkers, monitoring immune responses, and guiding immunotherapy decisions.
Increasing developments in the immuno-oncology sector, advancements in technologies such as next-generation sequencing (NGS), multiplex immunohistochemistry (IHC), and spatial biology platforms, along with a surge in demand for companion diagnostics and targeted therapies, are driving the immuno-oncology market growth.
Expanding assay applications beyond common cancers like melanoma and colorectal cancer to rare and solid tumors, integration of AI for improved biomarker analysis, and growth in emerging markets where healthcare infrastructure is rapidly developing are expected to create lucrative opportunities for the market in the future.
North America is expected to remain the dominant region, supported by strong R&D activity, early regulatory approvals, and high adoption of immunotherapy. However, the Asia-Pacific region is anticipated to show the fastest growth due to increasing investments, rising cancer incidence, and growing awareness of advanced diagnostic tools. Overall, the market is poised for substantial expansion as precision oncology continues to reshape cancer care globally.
Executive Summary
For more details on this report – Request for Sample
Immuno-Oncology Assays Market Dynamics: Drivers & Restraints
Increasing Developments in the Immuno-Oncology Sector are Expected to Drive the Immuno-Oncology Assays Market
Recent developments in immuno-oncology testing are significantly enhancing the prospects for more effective cancer diagnosis and treatment. A core focus of current innovation is on cancers with high prevalence, such as melanoma and colorectal cancer. Multiple companies and research institutions are introducing advanced diagnostic tools, grants, and platforms to support and accelerate this effort.
For example, in July 2024, Oxford BioDynamics announced a keynote presentation at the 14th World Summit for Clinical Biomarkers and Companion Diagnostics, highlighting the diagnostic, predictive, and prognostic capabilities of its EpiSwitch 3D genomics platform. This technology offers promising potential as a companion diagnostic assay.
Similarly, in February 2023, Agilent Technologies announced the integration of its xCelligence RTCA HT (real-time cell analysis high-throughput) platform with the BioTek BioSpa 8 Automated Incubator, enhancing workflow automation capabilities. This new combination of technologies was developed in response to market demands and offers innovative functionality for creating label-free high-throughput potency assays in the immuno-oncology field.
Further supporting innovation, Lunaphore launched the SPYRE Immuno-Oncology Grant Program in 2023 to help laboratories integrate spatial biology technologies into their immuno-oncology research. Meanwhile, Veracyte, Inc. shared data on its Immunoscore Immune Checkpoint (IC) assay, a tool designed to identify patients with metastatic colorectal cancer (mCRC), showcasing the expanding utility of immune profiling in treatment selection.
These advancements, along with increased investment in cancer research, growing awareness of diagnostic innovations, and the introduction of novel technologies, are collectively driving growth in the immuno-oncology assays market and offering new hope for personalized cancer therapy..
High Costs of Assays are Expected to Hinder the Immuno-Oncology Assays Market
The high cost of immuno-oncology assays is a significant barrier to market growth, particularly in low- and middle-income countries and smaller healthcare facilities. These assays often rely on advanced technologies such as multiplex immunohistochemistry, flow cytometry, next-generation sequencing (NGS), and spatial transcriptomics, all of which require expensive equipment, skilled personnel, and rigorous quality control.
For instance, automation systems and high-throughput platforms used in immuno-oncology diagnostics can cost between $40,000 and $60,000, excluding the ongoing expenses for reagents, software licenses, and data analysis infrastructure.
Immuno-Oncology Assays Market Segmentation Analysis
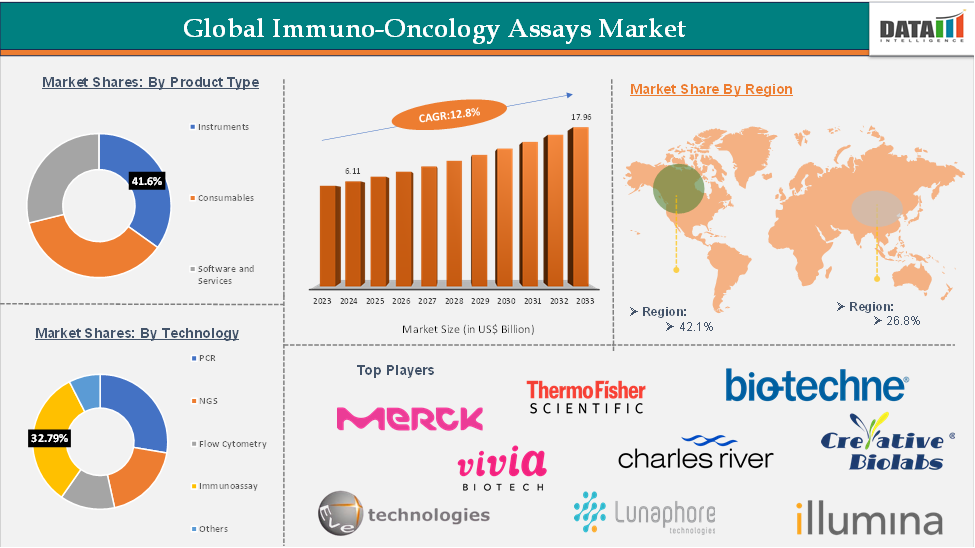
The global immuno-oncology assays market is segmented based on component type, cancer type, application, end user, and region.
Rising Demand for Consumables in Routine Cancer Biomarker Testing Drives the Consumables Segment
The consumables segment is expected to account for the largest share of the global immuno-oncology assays market owing to the recurring demand for assay kits, reagents, antibodies, buffers, and other laboratory consumables used across research, clinical diagnostics, and companion diagnostic applications. Unlike instruments, consumables require continuous replenishment for every test performed, making them indispensable in biomarker discovery, immune profiling, and immunotherapy response monitoring. The growing adoption of precision oncology, increasing cancer screening activities, and expanding clinical trials evaluating immune checkpoint inhibitors continue to support sustained demand for consumable-based assay products.
Reflecting this trend, industry participants are continuously expanding their immuno-oncology assay portfolios through the introduction of advanced biomarker detection solutions. Ongoing innovations in multiplex immunohistochemistry (IHC), flow cytometry, ELISA, and next-generation sequencing (NGS)-based assay kits are enabling researchers and clinicians to improve biomarker identification and patient stratification, further strengthening the market position of consumables.
Advancements in Next-Generation Sequencing and Multiplex Technologies Accelerate the Next-Generation Sequencing (NGS) Segment
The next-generation sequencing (NGS) technology segment is anticipated to witness the fastest growth during the forecast period due to its ability to simultaneously analyze multiple genomic biomarkers associated with cancer immunotherapy. NGS-based assays enable comprehensive tumor profiling, tumor mutational burden (TMB) assessment, microsatellite instability (MSI) detection, and biomarker discovery, supporting personalized treatment decisions and companion diagnostic development. Increasing integration of genomic sequencing into precision oncology workflows and expanding applications in translational research continue to accelerate adoption across healthcare and research institutions.
Supporting this momentum, companies and research organizations are investing in advanced genomic and AI-enabled biomarker analysis platforms to enhance assay performance and clinical utility. Continuous developments in high-throughput sequencing technologies, spatial biology, digital pathology, and AI-assisted biomarker interpretation are expected to strengthen the role of NGS-based immuno-oncology assays in precision cancer diagnostics and immunotherapy development over the coming years.
Immuno-Oncology Assays Market Geographical Analysis
North America is expected to hold 42.1% of the global immuno-oncology assays market
North America is expected to dominate the global immuno-oncology assays market, primarily due to its advanced healthcare infrastructure, high prevalence of cancer, and strong research and development ecosystem. The region continues to lead the global immuno-oncology assays market, bolstered by recent regulatory approvals and product launches that underscore the region's commitment to advancing cancer diagnostics.
For instance, in August 2024, the FDA approved the SeCore CDx HLA A Sequencing System as a companion diagnostic for afamitresgene autoleucel. This approval highlights the growing integration of companion diagnostics in immuno-oncology, ensuring that therapies are matched to patients based on specific genetic markers.
These developments reflect North America's pivotal role in the evolution of immuno-oncology diagnostics, driven by robust regulatory support, significant research investments, and a strong infrastructure for clinical implementation.
Asia-Pacific is expected to hold 26.8% of the global immuno-oncology assays market
The Asia-Pacific region is projected to be the fastest-growing market in the global immuno-oncology landscape, driven by a rising cancer burden, increased government investment, and expanding research capabilities.
With nearly 50% of global cancer cases occurring in Asia, countries like China, India, and Japan are witnessing surging demand for advanced cancer diagnostics and treatments. Government support through national cancer control programs and investment in biotech innovation is accelerating research and facilitating regulatory approvals for novel immunotherapies.
Additionally, the region’s improving healthcare infrastructure and growing participation in clinical trials are contributing to the rapid adoption of immuno-oncology assays and therapies. Together, these factors position Asia-Pacific as the fastest-growing region in the global immuno-oncology market in the coming years.
Immuno-Oncology Assays Market Top Companies
The top companies in the immuno-oncology assays market include Merck KGaA, Thermo Fisher Scientific Inc., Lunaphore Technologies SA., Eve Technologies., Vivia Biotech S.L, Illumina, Inc., Charles River Laboratories, Bio-Techne, Creative Biolabs, Miltenyi Biotec, Adipogen Life Sciences, among others.
Key Developments of the Immuno Oncology Assays Market
June 2026: CellCarta and Pillar Biosciences announced the successful development and clinical implementation of a customized FGFR next-generation sequencing (NGS) assay for a global Phase III oncology trial. The collaboration accelerated assay validation, regulatory submissions, and patient-selection workflows, strengthening precision oncology testing capabilities for advanced cancer research.
- May 2026: arcoris bio launched immunoMUSE®, a high-sensitivity multiplex immunofluorescence platform enabling researchers to use their own validated antibodies for flexible biomarker detection. The technology improves signal amplification, multiplex immuno-oncology analysis, and spatial biomarker profiling for tumor microenvironment research.
- April 2026: QIAGEN showcased its next-generation oncology research portfolio at AACR 2026, including the new QIAGEN Discovery Platform and enhanced Sample-to-Insight workflows. The platform integrates AI-powered data interpretation, automated sample preparation, and multi-omics analysis to support advanced cancer biomarker discovery and immuno-oncology assay development.
Key Takeaways
- The increasing adoption of precision medicine and personalized cancer treatment is emerging as a key industry trend, with healthcare providers and research organizations utilizing advanced immuno-oncology assays to identify predictive biomarkers, optimize immunotherapy selection, and improve patient outcomes.
- North America maintains a leading position, accounting for a significant share of the global immuno-oncology assays market, supported by its advanced oncology research ecosystem, widespread adoption of companion diagnostics, strong presence of leading biotechnology and pharmaceutical companies, and continuous investment in precision oncology.
- Asia-Pacific is projected to record the fastest growth during the forecast period, driven by expanding cancer incidence, increasing healthcare expenditure, growing clinical research activities, improving molecular diagnostics infrastructure, and rising government support for cancer screening and precision medicine initiatives.
- The rising global burden of cancer and the growing clinical adoption of immunotherapies are becoming major factors driving demand for advanced immuno-oncology assays that enable accurate biomarker identification, treatment monitoring, and patient stratification.
- Growing utilization of technologies such as next-generation sequencing (NGS), multiplex immunohistochemistry (mIHC), flow cytometry, polymerase chain reaction (PCR), and gene expression profiling is enhancing the accuracy and efficiency of immuno-oncology research and companion diagnostic development.
- Industry participants are increasingly prioritizing investments in biomarker discovery, AI-enabled data analysis, multiplex assay platforms, regulatory-compliant companion diagnostics, and strategic collaborations with pharmaceutical companies to strengthen their competitive position in the rapidly evolving precision oncology landscape.
- Increasing clinical trials involving immune checkpoint inhibitors, cell and gene therapies, cancer vaccines, and combination immunotherapy approaches are creating significant opportunities for assay developers, diagnostic companies, and contract research organizations to expand innovative testing solutions worldwide.
Immuno Oncology Assays Market Scope
| Metrics | Details | |
| CAGR | 12.8% | |
| Market Size Available for Years | 2023-2033 | |
| Estimation Forecast Period | 2026-2033 | |
| Revenue Units | Value (US$ Bn) | |
| Segments Covered | Product Type | Instruments, Consumables, Software and Services |
| Assay Type | Cell Proliferation Assays, Cell Migration and Invasion Assays, Phagocytosis Assays, Immune Cell Killing Assays, Others | |
| Route of Administration | PCR, NGS, Immunoassay, Flow Cytometry, Others | |
| Indication | Colorectal Cancer, Breast Cancer, Lung Cancer, Melanoma, Others | |
| End User | Academic Institutes, Research Organizations, Diagnostics Centers, Others | |
| Regions Covered | North America, Europe, Asia-Pacific, South America, and the Middle East & Africa | |
Why Purchase This Report?
The Immuno Oncology Assays Market report provides comprehensive intelligence for biotechnology companies, pharmaceutical manufacturers, diagnostic developers, contract research organizations (CROs), academic research institutes, healthcare providers, and investors seeking to understand emerging opportunities across cancer immunotherapy research and companion diagnostics.
Gain detailed insights into market drivers, restraints, opportunities, and emerging trends shaping immuno-oncology assay development.
Assess the impact of expanding cancer immunotherapy pipelines, biomarker discovery, and precision oncology initiatives on market growth.
Understand technology adoption across multiplex immunoassays, flow cytometry, ELISA, PCR, next-generation sequencing (NGS), immunohistochemistry (IHC), and other advanced assay platforms.
Evaluate demand patterns across pharmaceutical companies, biotechnology firms, clinical laboratories, academic research institutes, and contract research organizations.
Benchmark leading assay developers, reagent suppliers, instrument manufacturers, and strategic collaborations within the competitive landscape.
Identify high-growth opportunities associated with companion diagnostics, immune biomarker profiling, tumor microenvironment analysis, and translational oncology research.
- Support investment decisions, product development strategies, clinical research planning, and long-term commercialization initiatives.
The global immuno-oncology assays market report delivers a detailed analysis with 57 key tables, more than 46 visually impactful figures, and 168 pages of expert insights, providing a complete view of the market landscape.
Target Audience
- Manufacturers: Pharmaceutical, Medical Device, Biotech Companies, Contract Manufacturers, Distributors, Hospitals.
- Regulatory & Policy: Compliance Officers, Government, Health Economists, Market Access Specialists.
- Technology & Innovation: AI/Robotics Providers, R&D Professionals, Clinical Trial Managers, Pharmacovigilance Experts.
- Investors: Healthcare Investors, Venture Fund Investors, Pharma Marketing & Sales.
- Consulting & Advisory: Healthcare Consultants, Industry Associations, Analysts.
- Supply Chain: Distribution and Supply Chain Managers.
- Consumers & Advocacy: Patients, Advocacy Groups, Insurance Companies.
- Academic & Research: Academic Institutions.