

Renewable Natural Gas Market Overview
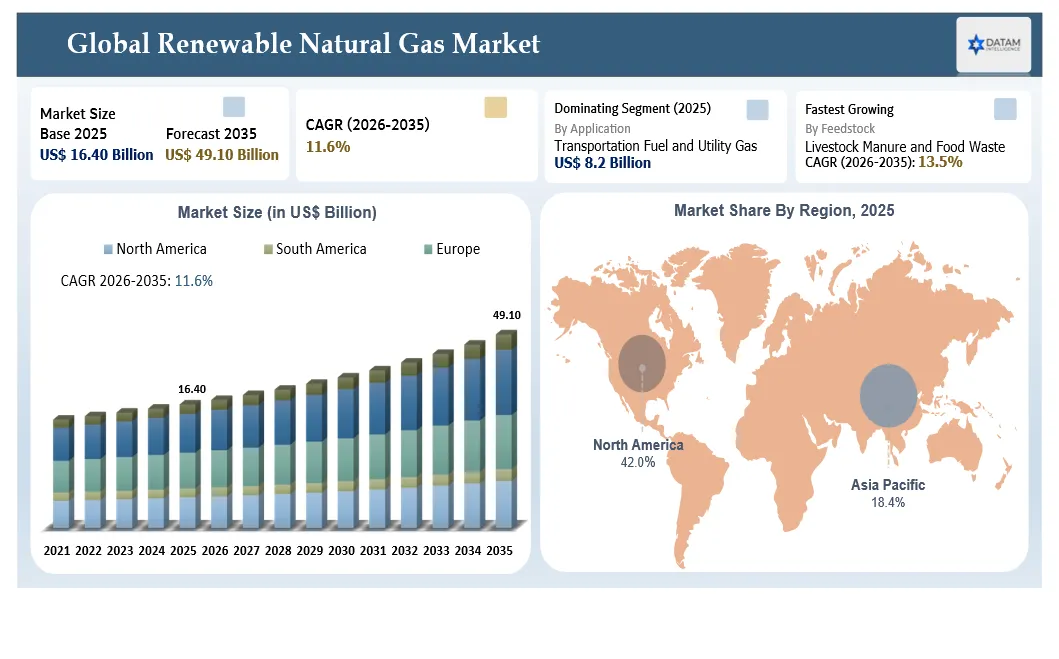
The global renewable natural gas market is estimated at US$16.40 billion in 2025 and is expected to reach US$49.10 billion by 2035, expanding at a CAGR of 11.6% during 2026-2035. The DataM estimate includes physical RNG sales, project-level upgrading services and monetized environmental attributes where they are directly tied to RNG transactions. Market growth is being driven by methane-abatement policy, landfill and manure management, low-carbon transportation fuel demand, utility renewable gas procurement and industrial efforts to decarbonize existing gas-fired processes.
The IEA reported in 2025 that more than 50 new policies supporting biogases had been introduced since 2020 and that the sustainable global potential of biogases is equivalent to roughly one-quarter of current global natural gas demand. Its assessment examined more than 30 feedstock types across over five million locations. This confirms that the constraint is less about theoretical feedstock availability and more about bankable project development, aggregation, permitting, interconnection and durable offtake.
Europe has established the clearest policy-backed scale target. The European Commission targets 35 bcm of annual biomethane production and use by 2030 and estimates investment needs of approximately EUR37 billion. North America remains the largest commercial market because the U.S. combines landfill gas, dairy manure and food-waste projects with transportation fuel incentives, state low-carbon fuel programs, federal renewable fuel credits and pipeline infrastructure. Asia-Pacific is expected to grow fastest as China, India, Japan and Australia expand compressed biogas, urban organics processing, industrial renewable gas and grid-injection programs.
| Metric | Details |
| 2025 Market Size | US$16.40 Billion |
| 2035 Projected Market Size | US$49.10 Billion |
| CAGR, 2026-2035 | 11.6% |
| Largest Region | North America |
| Fastest Growing Region | Asia-Pacific |
| Largest Feedstock Segment | Landfill gas |
| Fastest Growing Feedstock Segment | Livestock manure and food waste |
| Largest Application | Transportation fuel and utility gas |
| Fastest Growing Application | Industrial renewable heat and carbon-negative fuels |
Renewable Natural Gas Market Key Takeaways
- The market is estimated at US$16.40 billion in 2025 and projected to reach US$49.10 billion by 2035 at 11.6% CAGR.
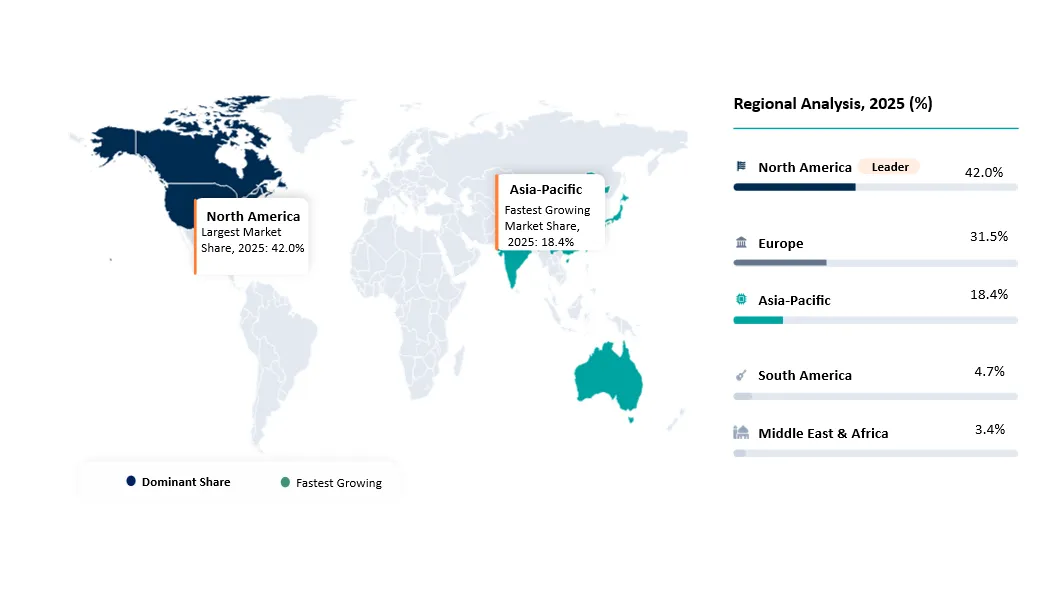
- North America accounts for approximately 42.0% of 2025 market value because its projects can combine physical gas revenue with federal and state environmental attributes.
- Europe represents about 31.5% of 2025 value and is supported by the EU target of 35 bcm annual biomethane production by 2030 and an estimated EUR37 billion investment requirement.
- Asia-Pacific is the fastest growing region as India expands compressed biogas, China develops urban and agricultural biogas, Japan increases utility and industrial procurement and Australia moves toward grid injection.
- The IEA identified sustainable biogas and biomethane potential equivalent to around one-quarter of current global natural gas demand, with more than 50 new policies introduced since 2020.
- Landfill gas remains the largest feedstock because gas collection infrastructure already exists at many large sites, while manure-based projects can generate very low or negative carbon-intensity scores where avoided methane is credited.
- Pipeline injection is the largest delivery mode, but virtual pipeline transport and small-scale liquefaction are expanding where project sites are distant from gas networks.
- Project economics increasingly depend on multiple revenue streams, including gas sales, tipping fees, renewable fuel credits, low-carbon fuel credits, digestate, fertilizer products and captured biogenic CO2.
- Feedstock control is emerging as a core competitive advantage. Long-term contracts with dairy farms, food processors, municipalities and waste haulers can be more valuable than ownership of upgrading equipment alone.
- Carbon accounting quality is becoming a procurement differentiator as buyers require auditable methane capture, chain of custody, leakage control and proof that environmental attributes are not double counted.
Why does this report matter in 2026?
Renewable natural gas is moving from a niche waste-to-energy product into a strategic decarbonization option for gas utilities, heavy transport, food processing, chemicals, buildings and distributed energy. Buyers need more than a headline market forecast. They need project-level intelligence on where feedstock is concentrated, which policies support revenue, how interconnection affects schedule, what carbon intensity can be achieved and which offtake structures can secure financing. The report helps developers prioritize feedstock clusters, utilities assess renewable gas procurement, fleet operators compare RNG with diesel and electricity, industrial buyers evaluate renewable heat and investors identify platforms with repeatable project economics.
Renewable Natural Gas Market White Space and Investment Opportunities
White space is strongest where a project can capture several value pools. Dairy and food-waste clusters can combine tipping fees, avoided methane, gas revenue, fertilizer products and low-carbon fuel credits. Landfill projects can upgrade existing gas that is currently flared or used in low-value power generation. Bio-CO2 capture from upgrading can support food, beverage, greenhouse, e-fuel or permanent storage applications. Industrial customers with existing gas infrastructure can use long-term RNG contracts to decarbonize without replacing boilers, kilns or thermal systems. Small-scale liquefaction and virtual pipelines can connect stranded projects to high-value customers before permanent pipeline interconnection is available.
Renewable Natural Gas Future Market Transformation
The market will evolve from stand-alone gas projects into integrated carbon-management platforms. Developers will increasingly optimize methane capture, nutrient recovery, bio-CO2, renewable gas certificates and digital traceability as a single commercial system. Project portfolios will shift toward standardized designs, centralized feedstock procurement, modular upgrading and repeatable interconnection agreements. Book-and-claim structures may expand access for buyers that cannot receive physical RNG, although credibility will depend on clear chain-of-custody rules and retirement of environmental attributes. Integration with hydrogen, e-methane and carbon capture can create additional demand for purified biogenic CO2.
Renewable Natural Gas Market Buyer Decision-Making Criteria
Buyers evaluate RNG through carbon intensity, delivered cost, contract tenor, gas quality, source traceability, policy eligibility and reliability. Utilities focus on pipeline specifications, interconnection, supply diversity and regulatory recovery. Fleet operators focus on carbon intensity, station access and fuel-credit sharing. Industrial buyers focus on price certainty, thermal compatibility, certificate credibility and Scope 1 accounting. Investors focus on feedstock contracts, project uptime, credit exposure, interconnection risk, construction cost and downside protection if environmental credit values weaken.
Renewable Natural Gas Market Economic and Investment Analysis
RNG projects are infrastructure assets with agricultural, waste, energy and carbon-market exposure. Revenue can include fixed or indexed gas sales, tipping fees, environmental attributes, digestate, fertilizer and bio-CO2. Capital intensity varies significantly by feedstock, scale, pipeline distance and upgrading specification. Dairy clusters require digesters, collection networks and interconnection, while landfill projects may leverage existing gas collection. The European Commission estimates EUR37 billion of investment is required to achieve the EU 35 bcm target. In California, the biomethane incentive program has been funded at US$80 million, with support of up to US$3 million for non-dairy clusters and US$5 million for dairy clusters. These figures show that interconnection remains a material cost and policy target.
Strategic Indicators for Renewable Natural Gas Market
High Regulation Impact
RNG economics are closely linked to renewable fuel standards, low-carbon fuel programs, methane rules, waste diversion mandates, grid injection standards and renewable heat policies. More than 50 new supporting policies have been introduced globally since 2020, according to the IEA.
High Investment Activity
Investment is moving into dairy clusters, landfill upgrading, municipal organics, food-waste digesters, interconnection pipelines, liquefaction and bio-CO2 capture. Europe alone estimates EUR37 billion is required to reach its 2030 biomethane target.
Feedstock Competition
Source-separated organics, food waste and manure can attract competing uses, while long-term access can be constrained by transport distance, contamination and seasonal supply.
Pricing Volatility
Physical gas prices, renewable fuel credits, low-carbon credits, renewable certificates and carbon offsets can move independently. Projects with fixed gas offtake and diversified environmental attributes have stronger downside protection.
Procurement Pressure
Buyers increasingly require chain-of-custody evidence, leakage controls, life-cycle carbon calculations, reliable delivery and clear ownership of environmental attributes.
New Technology Adoption
Membrane upgrading, cryogenic separation, biological methanation, digital digester control, methane sensors and AI-enabled feedstock optimization are improving plant yield and reliability.
Regional Expansion Opportunity
North America leads commercial deployment, Europe has the strongest policy target, Asia-Pacific has the fastest demand growth and South America has large agricultural and landfill feedstock potential.
Government Policy Support
EU REPowerEU, U.S. renewable fuel programs, California incentives, India compressed biogas initiatives and national waste strategies create project pipelines, although support differs by feedstock and application.
Carbon Accounting Scrutiny
Methane leakage, counterfactual assumptions, additionality, avoided emissions and credit ownership are becoming decisive issues for buyers and investors.
Infrastructure Leverage
RNG can use existing pipelines, storage, compressors, boilers and vehicle platforms, creating a lower-disruption pathway for selected gas users.
BCG Matrix: Company Evaluation
STAR
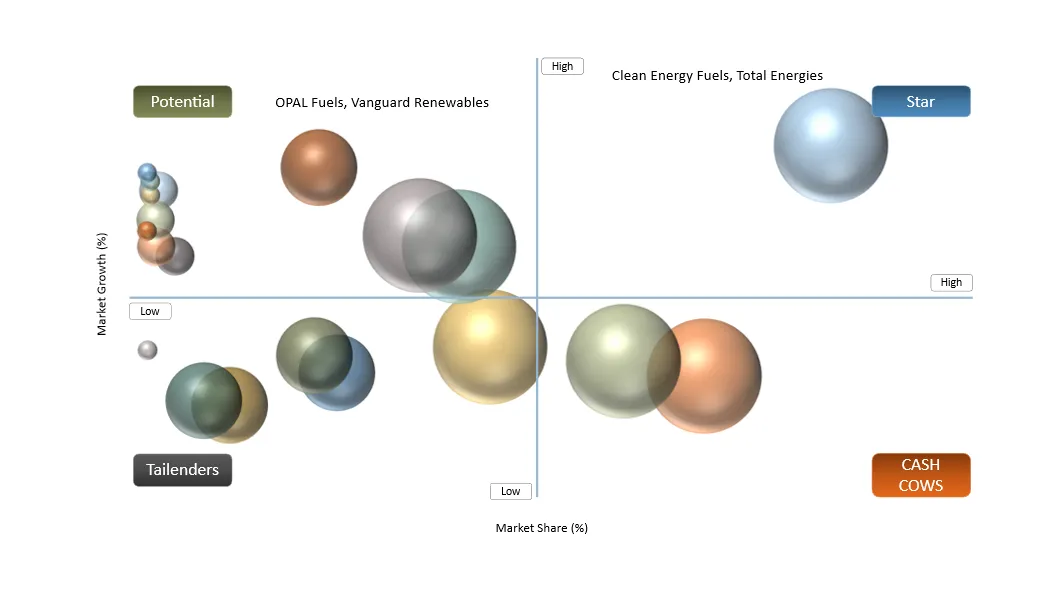
Clean Energy Fuels, Total Energies, Shell Renewable Natural Gas, Air Liquide, Engie, Nature Energy, Archaea Energy, Waste Management, Kinder Morgan, and Republic Services have been positioned as market leaders within the RNG market, given their large production capabilities, robust portfolio of renewable gas, solid financial strength, and wide geographical reach. These firms are continually developing their RNG projects and infrastructure, making use of strategic alliances.
POTENTIAL
Participants such as OPAL Fuels, Vanguard Renewables, Waga Energy, Greenlane Renewables, Bright Renewables, DMT Environmental Technology, Gasum, EnviTec Biogas, Ameresco, and SoCalGas are some of the high-growth players in this industry with considerable growth potential in the coming years. The competitive advantages of these players include upgraded technology, waste to gas innovations, regional expansion, and increasing investments in renewable energy projects.
Renewable Natural Gas Market Dynamics
| Driver | Market Growth Impact | Demand Concentration | Impacted Use Case | Strategic Impact |
Methane abatement and waste policy | 27% | North America, Europe, selected Asia-Pacific markets | Dairy, landfill, food waste and wastewater RNG | Creates value from avoided methane and waste diversion while improving project bankability. |
Low-carbon transport and utility procurement | 23% | U.S., Canada, Europe | Vehicle fuel and pipeline injection | Supports long-term offtake and environmental attribute monetization. |
Industrial decarbonization using existing gas assets | 18% | Europe, North America, Japan | Heat, steam, CHP and process gas | Allows users to reduce emissions without replacing all gas-consuming equipment. |
Energy security and domestic gas substitution | 16% | Europe, Asia-Pacific | Utility supply and industrial use | Reduces exposure to imported fossil gas and price volatility. |
Circular economy and agricultural income | 13% | Global agricultural regions | Manure, crop residue and food-waste projects | Creates additional revenue for farms and waste owners. |
Driver: Methane Abatement and Waste Management Policies
Methane abatement is the strongest structural driver because the climate impact of uncontrolled landfill, manure and wastewater methane is much greater than the combustion emissions associated with using captured methane as fuel. RNG projects can therefore generate value from both energy production and avoided methane. The IEA reported in 2025 that more than 50 new policies supporting biogases had been introduced since 2020. It also estimated that sustainable biogas and biomethane potential is equivalent to approximately one-quarter of current global natural gas demand. In the U.S., landfill methane programs, the Renewable Fuel Standard and state low-carbon fuel programs create multiple development pathways. California’s biomethane program has received US$80 million of funding and provides interconnection support of up to US$5 million for dairy clusters. In Europe, separate collection of organic waste and the 35 bcm biomethane target create demand for municipal organics, manure and food-waste projects. The investable trend is the formation of regional feedstock platforms that aggregate several waste owners into one upgrading and interconnection system.
Driver: Low-Carbon Fuel Demand and Renewable Gas Procurement
Transportation fuel and utility procurement create the most bankable demand because both can support long-term contracts and measurable carbon-intensity claims. Heavy-duty fleets can use compressed or liquefied RNG in existing natural-gas vehicles, while utilities can blend RNG into pipeline supply. In Europe, biomethane can be injected into existing gas networks and used by industrial, commercial and residential customers. The European Commission estimates that achieving 35 bcm of annual biomethane production by 2030 requires approximately EUR37 billion of investment. Corporate buyers are also using renewable thermal contracts and certificates to address Scope 1 emissions from boilers and process heat. The business opportunity is shifting toward developers that can offer verified carbon intensity, contract flexibility, geographic matching and credible environmental attribute retirement.
| Restraint | Drag on Growth | Primary Impact Area | Impacted Use Case | Strategic Impact |
High capital cost and interconnection complexity | 22% | Project development | Pipeline injection and dairy clusters | Long lead times and cost overruns can delay revenue and reduce equity returns. |
Dependence on policy credits | 19% | Project finance | Transport fuel and certificate-based sales | Credit price changes can materially alter project economics. |
Feedstock volume and contamination risk | 16% | Operations | Food waste and source-separated organics | Variable composition lowers gas yield and increases pretreatment cost. |
Methane leakage and carbon-accounting scrutiny | 14% | Compliance and customer acceptance | All RNG pathways | Weak measurement can reduce claimed emissions benefits. |
Community, odor and permitting concerns | 11% | Site development | Digesters and waste handling | Local opposition can delay construction and expansion. |
Restraint: High Capital Cost, Interconnection Complexity and Feedstock Risk
RNG projects combine waste handling, biological processing, gas upgrading and energy infrastructure, creating more development risk than conventional gas supply. Pipeline interconnection may require gas quality testing, compression, odorization, metering, control systems, rights-of-way and utility studies. California utility filings show that dairy pilot projects have experienced cost increases beyond originally authorized amounts, demonstrating the difficulty of estimating collection and interconnection costs. Feedstock risk is equally important. Food waste can contain packaging and contaminants, dairy manure volume can vary with herd size and operating practice and landfill gas quality changes over time. Investors increasingly require long-term feedstock agreements, minimum volume commitments, contamination provisions, performance guarantees and contingency for pipeline delay. Developers that standardize plant design and secure several feedstock sources within one cluster can reduce this risk.
Restraint: Policy Credit Dependence and Inconsistent Carbon Accounting
Many projects remain dependent on environmental attributes that can be more valuable than the physical gas. This creates exposure to changing credit prices, methodology revisions, eligibility rules and political priorities. Carbon intensity can differ sharply by feedstock. Dairy manure projects may achieve very low or negative scores because they avoid methane emissions, while crop-based projects face land-use and sustainability scrutiny. Leakage during digestion, upgrading and transport can weaken the climate benefit. Buyers therefore require direct measurement, lifecycle documentation and clear ownership of credits. Project sponsors should test economics under lower credit values and separate debt service from speculative upside. The strongest platforms combine fixed revenue, tipping fees, multiple end markets and transparent carbon accounting.
Renewable Natural Gas Market Segment Analysis
The market is segmented by feedstock, production pathway, upgrading technology, delivery mode, application, end user and commercial model. The expanded write-up below connects each segment to project economics, buyer requirements, technology selection and supporting market evidence.
By Feedstock: Landfill Gas Remains the Largest Commercial Base
Landfill gas is the largest feedstock segment because many large sites already operate collection wells, blowers and flares. Upgrading can convert gas that is flared or used for low-value power into pipeline-quality RNG. The opportunity is strongest at large landfills with stable methane flow, available pipeline access and long remaining site life. Waste Management, Republic Services, OPAL Fuels, Archaea Energy and Waga Energy have built or acquired portfolios around this model. Landfill projects can scale faster than new digesters because feedstock collection is already integrated into site operations. The main risks are declining gas production over time, siloxanes, hydrogen sulfide, nitrogen and oxygen contamination, interconnection distance and long-term ownership of environmental attributes.
By Feedstock: Livestock Manure Creates the Strongest Carbon-Intensity Upside
Dairy and livestock manure is one of the fastest growing feedstocks because covered lagoons and digesters prevent methane that would otherwise escape to the atmosphere. This can produce very low or negative lifecycle carbon-intensity scores in jurisdictions that credit avoided methane. California provides up to US$5 million of interconnection support for dairy clusters under its biomethane incentive program. Cluster models connect several farms to one upgrading or pipeline system, improving scale and spreading capital cost. The main buyer opportunity is transportation fuel, where carbon-intensity value can exceed physical gas value. Risks include herd concentration, animal-welfare scrutiny, nutrient management, odor, water use and dependence on policy methodology.
By Feedstock: Food Waste and Source-Separated Organics Support Circular Economy Models
Food and beverage waste can generate tipping-fee revenue alongside gas sales, making it attractive where disposal costs are high. Supermarkets, food manufacturers, restaurants and municipalities need compliant diversion routes as landfill restrictions expand. Feedstock quality is variable and often requires depackaging, contaminant removal, blending and hygienization. Projects close to urban centers can access larger waste volumes but face land, traffic and odor constraints. The strongest commercial model combines long-term waste contracts with an anaerobic digestion platform that produces RNG, digestate and recovered nutrients.
By Production Pathway: Anaerobic Digestion Dominates New Agricultural and Organic Waste Projects
Anaerobic digestion is the dominant pathway for manure, food waste, wastewater sludge and source-separated organics. It produces biogas through microbial conversion and can be deployed at farm, industrial or municipal scale. Plant performance depends on temperature control, retention time, feedstock blending, inhibition management and digestate handling. AI and advanced sensors are being used to predict volatile fatty acid accumulation, foaming and gas-yield changes. Co-digestion can improve yield by combining manure with higher-energy food waste, but it also increases pretreatment and contamination risk.
By Production Pathway: Thermal Gasification Expands the Feedstock Envelope
Thermal gasification and methanation can convert woody biomass, crop residues and other dry feedstocks that are unsuitable for anaerobic digestion. This pathway can produce bio-synthetic natural gas but has higher capital intensity, feedstock preprocessing requirements and technology risk. It is relevant in regions with forest residues, orchard removals or agricultural waste. A California woody biomass pilot proposal has cited a well-to-wheel carbon intensity of negative 18.9 gCO2e/MJ, indicating potential where waste biomass and carbon accounting align. Commercial scale will depend on reliable gas cleanup, methanation efficiency and long-term biomass supply.
By Upgrading Technology: Membrane Separation Gains Share Through Modularity
Membrane systems are gaining share because they are modular, have relatively low water use and can be expanded in stages. Multiple membrane passes separate CO2 and other impurities while controlling methane slip. They are attractive for farms, wastewater plants and mid-sized landfill projects. Performance depends on inlet gas conditioning, pressure, membrane selectivity and recovery design. Suppliers that integrate compression, hydrogen sulfide removal, siloxane treatment and remote monitoring can shorten commissioning and improve uptime.
By Upgrading Technology: Pressure Swing Adsorption and Water Scrubbing Retain Large Installed Bases
Pressure swing adsorption uses adsorbents to separate CO2 and impurities and is well suited to projects requiring dry gas and established operating experience. Water scrubbing is technically mature and can handle relatively large flows, although it requires water management and may have higher methane loss if poorly optimized. Technology selection depends on gas composition, scale, energy cost, methane recovery, water availability and pipeline specification. Buyers increasingly compare lifetime methane slip and maintenance cost rather than only equipment price.
By Delivery Mode: Pipeline Injection Is the Largest and Most Scalable Route
Pipeline injection is the largest delivery mode because it connects projects to broad gas demand and allows gas to be marketed through utility networks. It requires compliance with heating value, moisture, oxygen, hydrogen sulfide, siloxane and interchangeability standards. Interconnection can be a major bottleneck. California’s incentive program supports up to US$3 million for non-dairy clusters and US$5 million for dairy clusters, demonstrating the material cost of connecting projects to gas infrastructure. Projects with short lateral pipelines and experienced utility partners have a clear advantage.
By Application: Transportation Fuel Remains the Highest-Value Market in North America
Transportation fuel has historically supported the strongest RNG economics in North America because federal renewable fuel credits and state low-carbon fuel credits can be stacked with gas revenue. Heavy-duty trucks, refuse fleets, transit buses and captive fleets are the main buyers. The segment benefits from existing natural-gas vehicle platforms and fueling infrastructure, but long-term growth must account for battery-electric and hydrogen competition. RNG remains attractive for high-utilization fleets, waste trucks and locations where rapid electrification is difficult.
By Application: Industrial Heat Is Emerging as a Strategic Growth Segment
Industrial users in food processing, chemicals, glass, ceramics, pulp and paper and other thermal industries can use RNG in existing boilers and furnaces. This reduces capital disruption compared with full electrification. Demand is strongest where buyers need Scope 1 reductions and can secure long-term contracts or renewable gas certificates. The limitation is cost. Industrial customers require predictable pricing and credible carbon claims. Developers can improve bankability by matching projects to industrial clusters with stable baseload demand.
By End User: Gas Utilities Are Moving from Pilot Procurement to Portfolio Strategy
Gas utilities use RNG to diversify supply, support regulatory decarbonization goals and make use of existing infrastructure. Procurement models include utility-owned projects, interconnection support, long-term offtake and customer programs. Utilities prioritize gas quality, reliability, regulatory recovery and geographic diversity. The business opportunity extends beyond gas sales to interconnection engineering, certificate management and portfolio optimization.
By Commercial Model: Joint Ventures with Feedstock Owners Improve Alignment
Joint ventures between developers and farms, waste companies or food processors can secure feedstock and share upside. Feedstock owners contribute waste supply, land and operating knowledge, while developers contribute capital, technology, offtake and environmental attribute management. TotalEnergies and Vanguard Renewables announced a U.S. collaboration initially focused on ten projects with 0.8 TWh annual capacity and a potential expansion to around 60 projects and 5 TWh. This illustrates the scale advantages of repeatable partnerships.
Renewable Natural Gas Market Geographical Penetration
North America Renewable Natural Gas Market Outlook
North America is the largest market, representing approximately 42.0% of 2025 value. The U.S. combines landfill, dairy, food-waste and wastewater projects with pipeline infrastructure and high-value transportation credits. California remains the leading state market because of low-carbon fuel incentives, dairy methane policy and biomethane interconnection support. Canada is expanding clean fuel demand and municipal organics projects. Mexico has significant landfill and agricultural potential but a less mature credit environment.
Europe Renewable Natural Gas Market Outlook
Europe represents approximately 31.5% of 2025 value and has the clearest long-term policy signal. The European Commission targets 35 bcm of annual biomethane production and use by 2030 and estimates investment needs of EUR37 billion. Germany, France, Italy, Denmark, the Netherlands and the UK have established production and certificate markets, while Spain and Poland have large undeveloped feedstock potential. Denmark already supplies a substantial share of its gas from biogas and is a reference market for grid injection.
Asia-Pacific Renewable Natural Gas Market Outlook
Asia-Pacific is the fastest growing region. India is expanding compressed biogas through agricultural residue, municipal waste and manure projects. China has large livestock, wastewater and urban waste resources. Japan is developing imported and domestic biomethane procurement for utility and industrial decarbonization. Australia is moving from pilot injection toward commercial agricultural RNG, including a 2026 South Australian piggery project with an initial investment of AUD10 million and enough projected output to supply around 2,000 homes.
South America Renewable Natural Gas Market Outlook
South America has strong agricultural, sugar, livestock and landfill feedstock potential. Brazil is the leading market because of its bioenergy industry, large livestock base and natural gas demand. Argentina has dairy, livestock and municipal opportunities, while Chile has potential in landfills, wastewater and food processing. Growth depends on grid access, local financing and recognition of renewable gas attributes.
Middle East and Africa Renewable Natural Gas Market Outlook
Middle East and Africa remain early-stage but offer opportunities in landfills, wastewater, food waste and agro-industrial residues. UAE and Saudi Arabia can integrate RNG with waste diversion, industrial gas demand and circular economy programs. South Africa has landfill and wastewater potential. Turkiye has a larger gas network and agricultural base that could support biomethane development. The main barriers are project finance, feedstock collection and limited renewable gas certification frameworks.
| Region | 2025 Share | Key Opportunity | Buyer-Intent Insight |
| North America | 42.0% | Dairy, landfill and transport-fuel RNG | Buyers prioritize carbon intensity, credit eligibility and long-term supply. |
| Europe | 31.5% | Grid injection and industrial renewable heat | Policy target and certificate markets drive procurement. |
| Asia-Pacific | 18.4% | Compressed biogas, urban organics and industrial fuel | Localization and waste management create project pipelines. |
| South America | 4.7% | Agricultural and landfill RNG | Infrastructure and financing determine scale. |
| Middle East & Africa | 3.4% | Landfill, wastewater and industrial use | Early projects require integrated waste and energy partnerships. |
Renewable Natural Gas Market Competitive Landscape
- Competition is shifting from single-project development toward portfolio platforms with repeatable engineering, feedstock aggregation, centralized credit management and access to long-term capital.
- Large energy companies are entering through acquisitions and joint ventures to secure renewable gas supply and environmental attributes.
- Waste companies have an advantage in landfill gas because they control feedstock, sites and existing collection systems.
- Agricultural developers compete through farmer relationships, cluster design and nutrient management capability.
- Equipment suppliers are differentiating through methane recovery, low methane slip, remote monitoring, modularity and service guarantees.
- Utilities and gas marketers are becoming important partners because interconnection and offtake often determine project bankability.
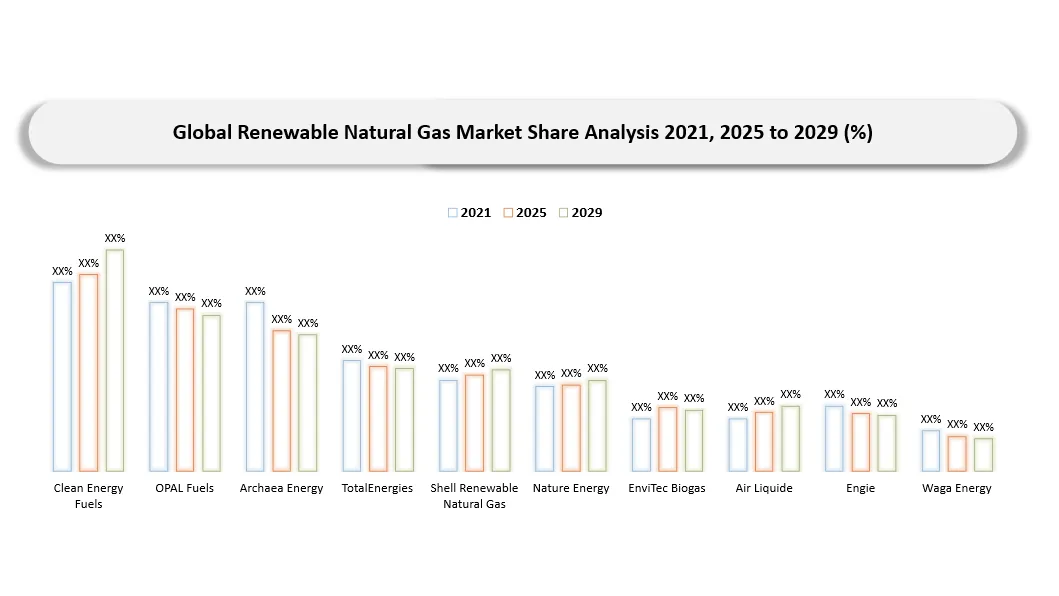
Key Companies of Renewable Natural Gas Market
- Clean Energy Fuels
- OPAL Fuels
- Archaea Energy
- Vanguard Renewables
- Nature Energy
- TotalEnergies
- Shell Renewable Natural Gas
- EnviTec Biogas
- Air Liquide
- Engie
- Waga Energy
- Bright Renewables
- DMT Environmental Technology
- Greenlane Renewables
- Ameresco
- Republic Services
- Waste Management
- Kinder Morgan
- SoCalGas
- Gasum
Renewable Natural Gas Market Major Pain Points
- High project development and pipeline interconnection cost.
- Dependence on environmental credit values and changing policy rules.
- Feedstock contamination, seasonal variability and competition for organic waste.
- Methane leakage and inconsistent lifecycle accounting.
- Community concerns related to odor, truck traffic, water and industrialization of farms.
- Long permitting, utility study and construction timelines.
- Limited financing for first-of-kind pathways such as biomass gasification and biological methanation.
- Difficulty securing long-term buyers for gas and environmental attributes at bankable prices.
Renewable Natural Gas Market Recent Developments
- 2026: LMS Energy and SunPork announced an AUD10 million first-phase RNG facility in South Australia to convert piggery effluent into grid-injected renewable gas, with projected output equivalent to the gas demand of approximately 2,000 homes.
- 2026: Ireland’s Stream BioEnergy advanced a plant designed to process around 90,000 tonnes of kitchen and garden waste annually and produce approximately 80 GWh of biomethane, although policy delays created uncertainty over where renewable attributes would be sold.
- 2025: The IEA published its global Outlook for Biogas and Biomethane, assessing more than 30 feedstock types across over five million locations and reporting more than 50 new supporting policies since 2020.
- 2025: The European Commission reiterated the 35 bcm annual biomethane target for 2030 and an estimated EUR37 billion investment requirement.
- 2025: California utility filings continued to highlight both the value and cost complexity of dairy biomethane cluster interconnections.
- 2024-2025: TotalEnergies and Vanguard Renewables advanced a U.S. partnership with an initial ten-project portfolio of 0.8 TWh per year and a longer-term pathway toward approximately 60 projects and 5 TWh.
Analyst View / Opinion on Renewable Natural Gas Market
- RNG will remain one of the few scalable options for reducing emissions from existing gas infrastructure while also addressing methane from waste.
- The highest-value projects will combine several revenue streams and maintain low measured methane leakage.
- Dairy manure can deliver the strongest carbon-intensity economics but faces the greatest policy and social scrutiny.
- Landfill gas offers the most repeatable near-term development model, especially where collection systems and pipelines are already available.
- Industrial renewable heat will become more important as transport incentives mature and buyers seek direct Scope 1 reductions.
- Long-term market leadership will depend on feedstock control, interconnection execution, carbon accounting and portfolio-scale financing.
Renewable Natural Gas Market Target Audience
| Industry | Who Should Buy This Report? | Reason to Buy |
| RNG Developers | CEOs, project development heads, commercial teams | Prioritize feedstocks, regions, offtake structures and technology pathways. |
| Gas Utilities | Renewable gas, regulatory and supply teams | Assess procurement, interconnection and portfolio decarbonization. |
| Waste Companies | Landfill, organics and strategy teams | Identify gas upgrading, tipping-fee and carbon value opportunities. |
| Agriculture and Food Companies | Farm owners, sustainability and operations teams | Monetize manure and organic waste while improving nutrient management. |
| Fleet Operators and Fuel Marketers | Fuel procurement and sustainability leaders | Compare RNG supply, carbon intensity and station economics. |
| Industrial Buyers | Energy, procurement and decarbonization teams | Evaluate renewable heat contracts and certificate structures. |
| Equipment Suppliers | Upgrading, digestion, compression and monitoring vendors | Identify high-growth technologies and partner opportunities. |
| Investors and Consultants | Infrastructure funds, private equity and advisors | Screen projects, platforms, policy exposure and acquisition targets. |
Why Choose DATAM?
- Data-driven insights covering market size, feedstock potential, project economics, policy exposure, buyer criteria and competitive positioning.
- Post-purchase analyst support for project screening, partner identification, offtake strategy and regional expansion.
- White papers and case studies focused on dairy clusters, landfill upgrading, industrial renewable heat, bio-CO2 and virtual pipelines.
- Annual updates reflecting policy changes, credit markets, project commissioning and technology developments.
- Specialized coverage of emerging markets in Asia-Pacific, South America and Middle East and Africa.
- Tailored research that separates physical gas value, environmental attributes and coproduct economics.
What DATAM Uniquely Provides
- Detailed 10-year forecasts by feedstock, pathway, upgrading technology, delivery mode, application, end user, commercial model and region.
- Project-level evaluation of interconnection, feedstock contracts, carbon intensity, offtake and credit exposure.
- Country-level policy and market-entry analysis for established and emerging RNG markets.
- White-space analysis across bio-CO2, industrial heat, small-scale liquefaction, digital traceability and environmental attribute aggregation.
- Competitive analysis spanning developers, waste companies, utilities, equipment suppliers, gas marketers and integrated energy companies.
Questions This Report Answers
- Which feedstocks provide the strongest combination of scale, carbon intensity and bankability?
- Where will pipeline injection, virtual pipeline and liquefied RNG create the best opportunities through 2035?
- How will low-carbon fuel policy, methane rules and biomethane targets reshape project economics?
- Which upgrading technologies are best suited to different gas compositions and plant scales?
- How can buyers structure long-term contracts while reducing credit and carbon-accounting risk?
- Which companies and partnership models are best positioned to build multi-project RNG platforms?