OTT TV and video Market Overview
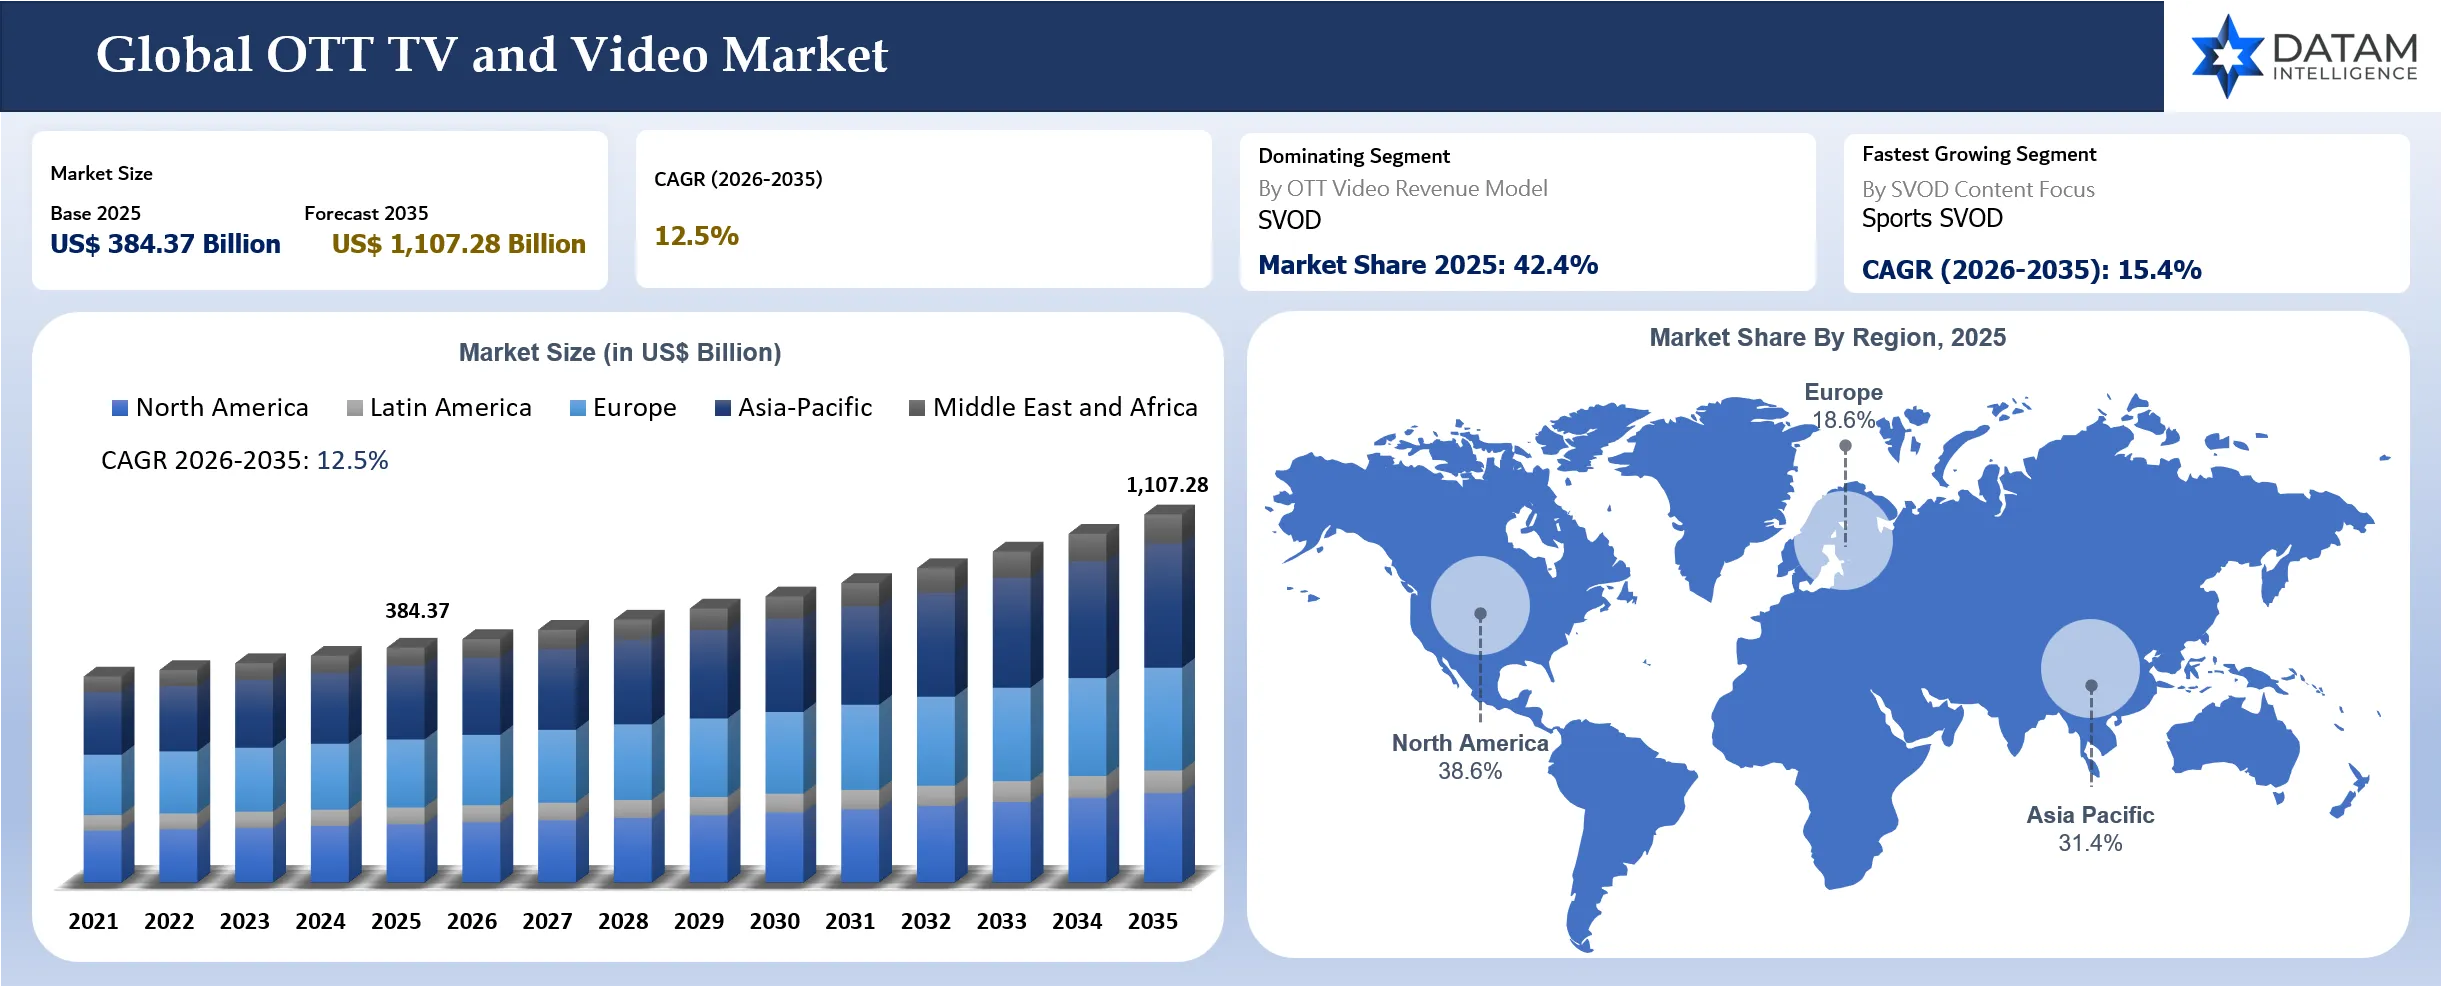
The global OTT TV and video market reached US$ 384.37 billion in 2025 and is expected to reach US$ 1,107.28 billion by 2035, growing at a CAGR of 12.5% during 2026 to 2035. The global OTT TV and video market reached a mature but still expanding phase in 2025 as streaming moved from a replacement for pay television into a broad digital entertainment system. Households now use streaming services for premium films, episodic entertainment, sports, kids’ programming, news clips, live channels, creator video and local language content. Growth no longer depends only on adding paid subscriptions. Revenue is now shaped by advertising tiers, FAST channels, sports streaming, telecom bundles, connected TV home screens and hybrid subscription models that help platforms manage churn while improving monetization per household.
Platform strategy has changed quickly. Large services are no longer competing only on exclusive series. They are building advertising technology, household identity, recommendation tools, live programming rights, connected TV distribution and bundle partnerships. Amazon has pushed Prime Video into a wider advertising stack linked to retail media and live sports. Netflix has made its ad-supported tier a central growth lever. Disney is moving toward a unified Disney+ and Hulu experience. ESPN has entered full direct streaming through an enhanced app. Fox’s agreement to acquire Roku shows how home-screen control and connected TV advertising are becoming strategic assets rather than simple distribution tools.
There is also diversity in terms of regional realities. North America still is an attractive region due to good connected TV penetration, sports content, ad-tier monetization, and good paid subscription base. Asia-Pacific is characterized by significant users’ growth because of the combination of India, Southeast Asia, Japan, South Korea, and Australia and mobile viewing, broadband and local content needs. In Europe, there are public broadcasters, regional operators, relationships with pay TV operators, and strict privacy regulations. In South America and Middle East and Africa regions, mobile-first viewing, telco bundling, and local language offerings drive the growth. The market leaders will not be only those platforms with the biggest content portfolios.
Latest Industry Activity and Key Developments
- June 2026: Fox Corporation agreed to acquire Roku, Inc. in a transaction valued at approximately US$22.0 billion to strengthen connected TV distribution, ad-supported streaming scale and home-screen control.
- November 2025: Amazon reported that Prime Video reached about 315 million monthly ad-supported viewers globally, reinforcing its push to connect streaming video with retail media, live sports and connected TV advertising.
- August 2025: Disney announced plans to fully integrate Hulu into Disney+ during 2026, creating a unified streaming interface for entertainment, general programming, news and sports.
- August 2025: ESPN launched its direct-to-consumer streaming service through the enhanced ESPN App, bringing the full suite of ESPN networks directly to fans for the first time.
- May 2025: Netflix highlighted that its advertising-supported plan reached more than 94 million global monthly active users, reinforcing the mainstream shift from pure subscription scale to hybrid monetization.
- November 2025: YouTube strengthened its connected TV position as long-form viewing expanded across older audiences and family households, moving creator-led video closer to traditional television consumption behavior.
- August 2025: Paramount Global and Skydance Media completed their merger, creating Paramount Skydance Corporation with direct-to-consumer streaming, studios and TV media assets.
- November 2025: Regional platforms in India expanded local language catalogs as regional language content accounted for more than half of OTT viewing and platforms reported stronger demand from tier two cities and diaspora audiences.
Recent Mergers and Acquisitions, Funding and Strategic Developments
- June 2026: Fox Corporation announced an agreement to acquire Roku, Inc. for approximately US$22.0 billion, strengthening its connected TV distribution, streaming advertising and platform strategy.
- November 2025: Amazon reported Prime Video’s average ad-supported monthly viewers reached about 315 million globally, supporting its broader retail media and connected TV advertising stack.
- August 2025: Paramount Global and Skydance Media completed their merger, creating Paramount Skydance Corporation with studios, direct-to-consumer and TV media operations.
- August 2025: Disney announced full Hulu integration into Disney+ during 2026 to simplify the user experience and strengthen bundled entertainment economics.
- August 2025: ESPN launched its direct-to-consumer streaming product through the enhanced ESPN App with access to ESPN linear networks and digital services.
- May 2025: Netflix reported that its ad-supported plan reached more than 94 million global monthly active users, supporting advertiser interest in premium streaming inventory.
Market Scope
| Metrics | Details | |
| Market Size In 2025 | US$ 384.37 Billion | |
| Market Size By 2035 | US$ 1,107.28 Billion | |
| CAGR During 2026 To 2035 | 12.5% | |
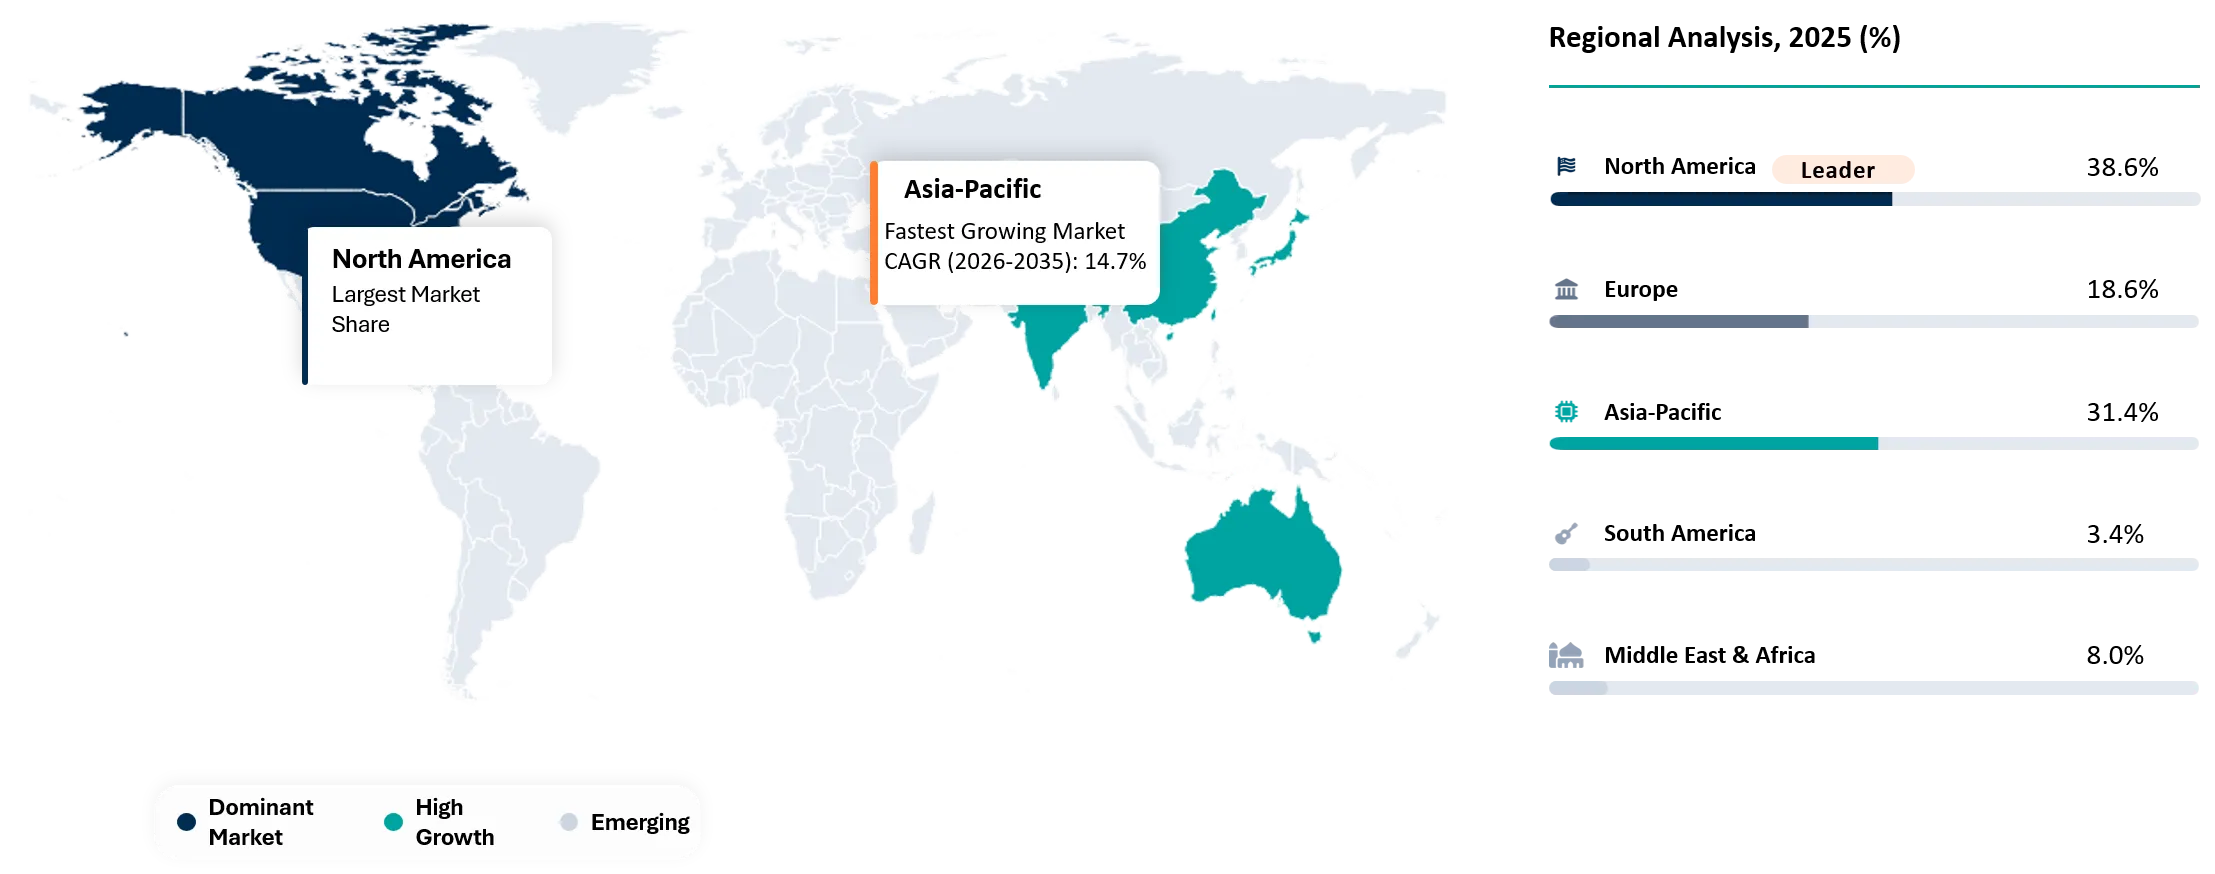
| Largest Region In 2025 | North America, 38.6% market share in 2025 | |
| Fastest Growing Region | Asia-Pacific, 14.7% CAGR between 2026 and 2035 | |
| Key Regional Shift | Asia-Pacific is expected to increase from 31.4% market share in 2025 to 43.0% market share by 2035 | |
| Leading OTT Video Revenue Model | SVOD | |
| Fastest Growing OTT Video Revenue Model | FAST | |
| Leading SVOD Commercial Access Model | DTC SVOD | |
| Fastest Growing SVOD Commercial Access Model | Telco Bundled SVOD | |
| Leading SVOD Content Focus | Entertainment and General SVOD | |
| Fastest Growing SVOD Content Focus | Sports SVOD | |
| Market Maturity | Growth Stage | |
| By OTT Video Revenue Model | SVOD (Subscription Video On Demand) AVOD (Advertising Supported OTT Video) EST (Electronic Sell Through) OTT Video FAST (Free Ad Supported Streaming TV) Live OTT TV TVOD (Transactional OTT Video) | |
| By SVOD Commercial Access Model | DTC (Direct To Consumer) SVOD Mobile Only SVOD Multi Service Bundle SVOD Pay TV Operator Add On SVOD Telco Bundled SVOD Third Party Aggregator Sold SVOD | |
| By SVOD Content Focus | Entertainment and General SVOD Kids and Family SVOD Local Language SVOD Sports SVOD | |
| By SVOD Platform Origin | International Platform SVOD Local and Regional Platform SVOD | |
| By Connectivity Indicator | Fixed Broadband Subscriptions Internet Users Mobile Broadband Subscriptions 4G Coverage 5G Coverage | |
| By Region | North America | U.S., Canada, Mexico |
| Europe | Germany, France, Italy, Spain, Netherlands, Sweden, Norway, Denmark, Finland, Belgium, Switzerland, Austria, Poland, Czech Republic, Portugal, Ireland, Russia | |
| Asia-Pacific | India, Japan, Australia, South Korea, Indonesia, Malaysia, Philippines, Singapore, Thailand, Vietnam, Taiwan, Hong Kong | |
| Latin America | Brazil, Argentina, Colombia | |
| Middle East and Africa | UAE, Qatar, Kuwait, Bahrain, Oman, South Africa, Nigeria, Kenya, Morocco, Israel, Turkiye | |
| Report Insights Covered | Competitive Landscape Analysis, Company Profile Analysis, Market Size, Share, Growth | |
Key Takeaways
- North America remains the largest region with 38.6% market share in 2025 because connected TV penetration, subscription history, programmatic advertising depth and premium sports rights support high revenue per household.
- Asia-Pacific is expected to be the fastest-growing region with a CAGR of 14.7% during 2026 to 2035 as mobile broadband, local language services, bundled access and lower-cost viewing models convert large digital audiences into monetized households.
- Asia-Pacific is expected to increase from 31.4% market share in 2025 to 43.0% by 2035, making it the most important regional shift in the global streaming economy.
- SVOD remains the leading OTT video revenue model because recurring subscriptions still fund premium originals, series catalogs, family franchises and premium live content.
- FAST is growing fastest because viewers are more willing to accept advertising when household budgets are under pressure and content discovery is easy through connected TV interfaces.
- Telco bundled SVOD is gaining momentum in mobile-first countries because operators can reduce payment friction and give platforms a lower-cost customer acquisition channel.
- Sports SVOD is becoming a premium growth pocket as rights owners move live events directly to streaming and use bundles to reduce churn around seasonal viewing.
- Platform origin matters because international services bring scale while local and regional services defend loyalty through language, cultural fit, pricing and payment integration.
Why Does This Report Matter In 2026?
The market matters in 2026 because the streaming sector is entering a more disciplined commercial cycle. Earlier competition rewarded rapid subscriber growth and large content spending. Current conditions reward profitable growth, better packaging and advertising execution. Price increases, password-sharing controls and content cost inflation have made churn management a board-level issue. Platforms now need a stronger balance between subscription revenue, ad revenue, licensing income and partnership distribution.
Sports rights are becoming a major swing factor. Live sports keeps audiences engaged, supports premium pricing and attracts advertisers that want predictable reach. ESPN’s DTC launch through the enhanced ESPN App marks a major shift because full network access is now available directly to fans. Sports-led services can raise ARPU but rights inflation can also pressure margins. Platforms must package sports carefully across standalone plans, bundles and authenticated pay TV relationships.
The connected TV layer is reshaping competitive power. A household may have five or more apps but only one home screen. Discovery, search, recommendations and featured placement influence what viewers watch. Platform owners can steer traffic toward owned channels, ad-supported services and partner inventory. Such control makes device ecosystems and operating systems critical to future streaming economics. Content owners without strong distribution visibility may face higher customer acquisition costs.
Strategic Indicators For OTT TV and Video
High Regulation Impact
Regulation has a growing impact because streaming now touches advertising standards, content moderation, children’s safety, data privacy, consumer billing and local content rules. Governments increasingly treat digital video platforms as major media companies rather than simple technology services. Europe’s privacy and platform rules influence ad targeting and data use. India, the Gulf, Australia and other markets monitor content standards, local compliance and intermediary obligations. Regulatory exposure rises when platforms combine user data, targeted advertising, children’s content and cross-border content libraries.
Compliance burden is especially high for advertising supported models. Platforms must manage consent, measurement transparency, brand safety, age-appropriate targeting and content adjacency. Advertisers want reach but also need assurance around where campaigns appear. Connected TV advertising adds further complexity because household-level targeting may involve device IDs, account data, viewing behavior and retail media signals. Strong vendors will build privacy-safe measurement and transparent inventory controls instead of treating compliance as a back-office issue.
Content regulation also affects local market entry. Some countries require content classification, local office presence, takedown processes, censorship compliance or domestic production support. Global platforms need local legal and editorial processes to operate smoothly. Smaller services may avoid markets with complex rules because compliance cost can exceed expected revenue. Regulatory strength therefore favors scaled platforms and well-funded local operators that can manage licensing, data governance, billing rules and content review at national level.
High Investment Activity
Investment remains active but more selective than the peak growth years. Capital is now flowing toward advertising technology, sports streaming, connected TV operating systems, measurement systems, local content studios, FAST infrastructure and bundling platforms. Investors are less interested in undifferentiated subscription apps that rely only on licensed content. A platform needs a clear audience, defensible programming, distribution partnerships or advertising advantage to attract premium capital.
Large media groups are using acquisitions and integration to improve control over distribution and monetization. Fox’s agreement to acquire Roku is a clear example of strategic value moving toward connected TV access and ad-supported scale. Paramount and Skydance completed their merger in August 2025 which created a reorganized media company with studios, direct-to-consumer operations and television assets. Disney’s Hulu integration plan shows how major groups are simplifying interfaces and reducing fragmentation inside their streaming portfolios.
Advertising infrastructure is another investment priority. Premium streaming inventory needs better targeting, frequency control, brand safety and cross-platform measurement. Amazon has an advantage because it connects viewing behavior with retail data and advertiser demand. Netflix is building its advertising business after scaling its ad-supported plan. Regional platforms are also improving ad products because advertisers want local audiences at efficient rates. Spending is likely to focus on yield optimization rather than basic video delivery.
Supply Chain Disruption
The supply chain is not physical in the traditional sense but it is exposed to content, bandwidth, production and technology constraints. Content production can be disrupted by labor negotiations, inflation, local filming rules, studio consolidation and rising talent costs. Sports rights create another supply risk because premium rights packages are limited and auction-driven. Platforms that depend heavily on licensed libraries can face sudden catalog loss when studios reclaim content for owned services.
Technology supply chains matter as well. Streaming quality depends on content delivery networks, cloud infrastructure, smart TV integrations, app store policies, payment processors and ad decisioning systems. Any disruption in CDN performance, platform certification or device compatibility can affect viewing experience. Larger services can negotiate better technical terms and maintain multi-CDN strategies. Smaller players may rely heavily on third-party vendors and face higher risk when traffic spikes during live sports or major releases.
Ad-supported models add operational complexity. Platforms must fill inventory without damaging user experience. Poor ad pacing can increase churn while weak fill rates reduce revenue. Measurement inconsistencies across connected TV devices, mobile apps and web environments can frustrate advertisers. Services that manage ad load, targeting and reporting more cleanly will protect both viewer trust and advertiser value. The strongest supply chains will integrate content rights, cloud operations, ad technology and device distribution into one commercial system.
Pricing Volatility
Pricing volatility is rising because platforms need to offset content costs while protecting household affordability. Subscription price increases can improve revenue in mature markets but may raise churn in price-sensitive households. Password-sharing controls have helped some platforms convert non-paying users into paid accounts but aggressive enforcement can also push users toward ad-supported plans, bundles or free alternatives. Pricing strategy therefore has to reflect local income, content depth and available substitutes.
Ad-supported pricing gives platforms more flexibility. A lower monthly fee can protect reach while advertising contributes incremental revenue. Netflix and Disney have used ad tiers to serve budget-conscious households without fully sacrificing monetization. FAST services offer a no-cost path and can build viewing habits before upselling users into paid ecosystems. Strong pricing architecture now includes premium ad-free tiers, ad-supported tiers, annual plans, bundles, mobile-only products and partner-sold plans.
Sports pricing remains the most sensitive area. Live sports rights are costly but valuable because fans watch consistently and advertisers pay for live reach. ESPN’s direct service shows how premium sports can move into streaming while still supporting bundle logic. Platforms must avoid pricing sports too low because rights costs need recovery. They also cannot price too high because casual fans may churn after major seasons. Strong services will use seasonal packaging, multi-service bundles and personalized offers to smooth revenue through the year.
Procurement Pressure
B2B buyers in the streaming ecosystem are under pressure to prove return on technology spending. Media companies need vendors that improve engagement, reduce churn, raise ad yield or lower operational cost. Purchases of recommendation engines, cloud playout, ad servers, measurement tools, payment systems and personalization software are now judged against commercial outcomes. Technology vendors that cannot show revenue impact may struggle with renewals.
Content procurement is also changing. Platforms are buying fewer broad libraries and more targeted rights that fit audience strategy. Kids content, local language drama, sports and franchise programming can justify retention spending when audience fit is clear. Mid-tier general entertainment faces more pressure because viewers already have too much choice. Producers need sharper pitches around audience data, regional appeal and franchise potential.
Telecom and pay TV partners have their own procurement logic. Bundling streaming services can reduce churn and improve broadband value perception. Operators want flexible commercial terms, revenue sharing, simple activation and low customer support burden. Streaming platforms want partner reach without losing customer data or brand control. Successful deals will balance distribution scale with ownership of user relationships.
New Technology Adoption
Technology adoption is strongest in recommendation systems, ad decisioning, dynamic packaging, real-time analytics, content localization, video compression and connected TV operating systems. Recommendation quality matters because large catalogs can overwhelm users. Better discovery reduces churn and increases viewing time. Services that personalize rows, previews, trailers and search results can improve engagement without spending more on content.
AI is now entering the streaming workflow across dubbing, subtitling, metadata creation, editing support, promotional creative and ad targeting. Localized content can reach more markets when translation and dubbing workflows become faster. AI can also help platforms understand content scenes, themes and viewer behavior. Human review remains important because entertainment tone, cultural meaning and rights metadata require judgment. The best use cases will improve speed while protecting brand quality.
Connected TV technology will shape the next phase. Operating systems can promote channels, surface sports events, personalize recommendations and support shoppable ads. Device-level data can improve planning when handled responsibly. Super aggregation is becoming more important because households want one place to search across services. Platforms that secure strong placement inside smart TV ecosystems will gain lower acquisition costs and better retention.
Regional Expansion Opportunity
Asia-Pacific offers major growth because mobile broadband, connected TV adoption and local content consumption are expanding together. India reported a large online video audience in 2025 and connected TV usage rose sharply. South Korea, Japan and Australia are high-value markets with strong broadband and advanced viewing habits. Southeast Asia is more price-sensitive but offers strong mobile-first growth. Platforms need regional pricing, local payment options and language-specific content to win.
Middle East and Africa present uneven but attractive opportunities. Gulf markets have high connectivity, strong purchasing power and demand for Arabic, international and sports content. Saudi Arabia and UAE support premium services and telco bundling. African markets rely more on mobile viewing, prepaid plans and affordable access. MultiChoice remains important because local sports, payment familiarity and distribution strength matter. Global platforms need telecom alliances and flexible pricing to scale across the region.
Europe remains a revenue-quality market. Viewers have high expectations for local content, privacy standards and broadcast-quality reliability. Public broadcasters and domestic platforms create stronger competition than in many emerging markets. The UK, Germany, France, Italy, Spain, the Nordics and Benelux markets each have distinct content habits. Services that use one generic European strategy may underperform. Local rights, national language programming and compliance readiness remain essential.
Government Policy Support
Government policy can support growth through broadband expansion, 5G deployment, digital infrastructure funding and creative industry incentives. Better connectivity increases addressable households and improves viewing quality. Film production incentives also help platforms build local libraries. Countries that support digital payments and affordable broadband create stronger foundations for paid and ad-supported streaming.
Policy support can also come with obligations. Local content quotas, cultural protection rules, children’s safety requirements and tax obligations can raise operating costs. Platforms benefit when rules are clear and consistently enforced. Uncertainty around content takedowns, data residency or foreign ownership can slow investment. Strong market entry planning requires both commercial strategy and regulatory mapping.
Public-sector media strategies also influence competition. Public broadcasters in Europe and parts of Asia have strong digital offerings that set quality expectations and preserve local culture. Private platforms must differentiate through exclusive entertainment, sports or user experience. Government-backed broadband expansion helps the whole sector but strong public digital media can also limit paid subscription growth in some categories.
AI Impact Analysis
Artificial intelligence has brought changes in the way streaming industry operates in terms of discoverability, content management, ads and localization. Recommendation systems play a role in determining the content that a person watches. The more advanced ones understand not only your watching history, but also your emotions, overlap between genres, preferences regarding actors, preferred language, and even housemate behavior. Discovery becomes a business asset since the quicker a user finds something, the less likely he is to churn.
The second area of influence of artificial intelligence is ads. It allows for more precise audience segmentation, frequency capping, contextual ad serving and creative optimization. Connected TV inventory becomes more valuable as advertisers rely on measurement and avoid wasted impressions. Platforms like Amazon benefit from the connection of purchasing and viewing audiences. Privacy-preserving modeling will be significant as regulators and users become concerned about the usage of data.
AI will also reduce content workflow cost. Dubbing, subtitling, metadata tagging, trailer creation and quality control can become faster. Local language expansion becomes easier when localization workflows are efficient. Creative judgment will remain important because poor localization can damage brand trust. Platforms that combine AI-assisted speed with human editorial review will scale better than those relying on automation alone.
Disruption Analysis
The greatest disruption comes from the shift from subscription competition to hybrid monetization. Consumers are combining paid subscriptions, ad-supported offerings, FASTs, free creator videos, and pay-per-view. The days of assuming that one household subscribes to all services for an entire year are long gone. For a successful service, it needs to compete based on content, pricing, discoverability, and bundle offering.
Connected TV OS is generating yet another disruption. Companies who used to have access to customers directly now are relying on placement and device ecosystem. A Smart TV user interface might make it easier or harder for one household to open Netflix, YouTube, Disney Plus, Prime Video, Roku Channel, Tubi, and other services or apps.
Sports streaming is also reshaping market structure. Fans may accept higher prices for live rights but can churn after seasons end. Sports can bring appointment viewing back into digital platforms but rights cost creates financial risk. Strong services will package sports with general entertainment, highlights, fantasy tools, news and personalized features to keep users engaged beyond live events.
BCG Matrix: Company Evaluation

Star
Stars include Netflix, The Walt Disney Company, Amazon.com, Inc., Alphabet Inc., Roku, Inc., Comcast Corporation, Warner Bros. Discovery, Inc. and Paramount Skydance Corporation. The strength of these corporations is global audience, high-quality content, distribution via connected TVs, technology for advertisements, subscription system and brand. The companies influence pricing, ads, bundling and customers' expectations in several regions at once. Also, they have enough financial resources for investments in sports broadcasting rights and connected TV infrastructure.
Potential
The potential companies include DAZN Group Limited, Zee Entertainment Enterprises Limited, Reliance Industries Limited, CANAL+ S.A., ITV plc, MultiChoice Group Ltd., Tencent Holdings Limited, iQIYI, Inc., Alibaba Group Holding Limited and Sony Group Corporation. The growth of these companies will be achieved due to their power in the local market, regional language skills, positions in sports broadcasting, cooperation with telecommunication providers and connected TVs. Such providers may not be able to compete globally with the previous corporations, but they can successfully defend attractive markets.
Market Dynamics
Driver Impact Analysis
| Driver | Market Growth Impact | Demand Concentration | Impacted Use Case | Strategic Impact |
Bundled Streaming Becomes The Default Household Access Path | High | North America, Europe and Asia-Pacific | Multi Service Bundle SVOD | Reduces churn and improves payment convenience |
FAST Channels Turn Cost Pressure Into Ad Inventory Growth | High | U.S., Europe and South America | FAST and AVOD | Expands ad-supported viewing and connected TV inventory |
Local Language Libraries Improve Paid Retention In Mobile-First Markets | Medium To High | Asia-Pacific, Middle East and Africa and South America | Local Language SVOD | Protects regional loyalty and supports lower churn |
Driver: Bundled Streaming Becomes The Default Household Access Path
Bundling is becoming one of the strongest growth drivers because households want simpler access and better value. A single household may already pay for broadband, mobile service, gaming, music, cloud storage and multiple video apps. Standalone subscriptions become harder to defend when budgets tighten. Bundles reduce decision fatigue and make streaming feel like part of a broader digital package.
Media companies are also using bundles to reduce churn. A service with one hit show can lose users after the season ends. A bundle with entertainment, kids content, sports and news has more daily utility. Disney’s move toward a combined Disney+ and Hulu experience reflects this logic. ESPN’s DTC launch also supports a broader package around sports and general entertainment.
Telcos and pay TV operators benefit from bundling because streaming services can support broadband retention. Platforms gain distribution and billing support while operators gain a stronger consumer proposition. The commercial challenge is data ownership. Streaming services want direct customer insight while operators want to control the relationship. Deals that balance activation simplicity, revenue share and data visibility will scale best.
Driver: FAST Channels Turn Cost Pressure Into Ad Inventory Growth
FAST channels are growing because they offer free content in a familiar linear format. Viewers can watch without choosing a specific title or paying another monthly fee. Platforms can use older library content, niche genres, news, sports highlights and themed channels to build viewing hours. Advertisers gain brand-safe inventory inside connected TV environments.
FAST also helps platforms monetize content that may not justify premium subscription investment. Library shows, reality programming, local channels and genre-based feeds can generate long-tail value. Roku, Tubi, Pluto TV, Samsung TV Plus and similar services have helped normalize free streaming on connected TV screens. The model works well when ad load is managed carefully and discovery is easy.
The economics are attractive but not automatic. FAST services need scale, ad sales capability, content rights and reliable measurement. Poorly curated channels can feel low quality and weaken viewer loyalty. Strong platforms will use data to build channels around audience behavior and local preferences rather than simply placing old content into linear feeds.
Restraint Impact Analysis
| Restraint | Drag On Market Growth | Primary Impact Area | Impacted Use Case | Strategic Impact |
Password Sharing Controls Raise Churn Risk In Price Sensitive Homes | High | SVOD Retention | DTC SVOD | Can lift ARPU but may reduce household goodwill |
Content Licensing Inflation Compresses Platform Margins | High | Content Economics | Sports and Premium Entertainment | Forces price increases, ad tiers and catalog discipline |
Restraint: Password Sharing Controls Raise Churn Risk In Price Sensitive Homes
Password-sharing controls can improve paid conversion but also create churn risk. Some users convert into paid accounts when access is restricted. Others move to lower-priced tiers, rotate services or use free alternatives. The impact depends on household income, content demand and available substitutes. Mature markets may absorb the change better than mobile-first emerging markets.
Platforms need careful messaging. A strict enforcement approach can damage goodwill if viewers feel punished. A smoother approach offers profile transfer, lower-cost ad tiers and family plan options. Netflix showed that password controls can support revenue growth when paired with strong content and entry-level pricing. Other platforms may not see the same outcome if engagement is weaker.
The restraint is especially important for markets where households share payments across extended families or informal networks. India, Southeast Asia, South America and parts of Middle East and Africa require pricing plans that reflect local behavior. Mobile-only plans and telco bundles can reduce backlash. A one-size-fits-all enforcement model would create avoidable customer loss.
Restraint: Content Licensing Inflation Compresses Platform Margins
Content cost remains a structural restraint. Premium drama, sports, animation and franchise programming require large investment. Competition among global platforms, broadcasters and local services keeps rights expensive. Sports rights are especially difficult because they are scarce and often bid up by multiple buyers seeking live audience scale.
Rising content cost can compress margins even when subscriber revenue grows. Platforms may respond with price increases, ad tiers, content cuts or licensing deals. Each response carries risk. Price increases can raise churn. Advertising can change viewing experience. Content cuts can weaken brand value. Licensing can help cash flow but may strengthen rivals.
The best operators will be disciplined. They will invest in content that supports retention, acquisition and advertising value instead of chasing volume. Local content can deliver strong returns when matched to culture and language. Sports can work when packaged across subscription, advertising and sponsorship. General entertainment spending needs sharper measurement because audience attention is fragmented.
Segment Analysis
SVOD Remains the Anchor, but Advertising-Supported Models Are Rewriting Growth
SVOD remains the commercial anchor because recurring revenue supports content investment and predictable planning. Paid subscriptions still matter for premium entertainment, sports, kids programming and ad-free experiences. Households continue to pay when a service offers reliable value, exclusive content and a smooth interface. The challenge is that most households now manage a portfolio of services rather than committing permanently to every app.
Advertising-supported models are becoming equally important because they expand reach. AVOD and FAST services appeal to price-sensitive viewers and help platforms monetize audiences that would not pay for another subscription. Premium ad tiers also allow major platforms to keep users who might otherwise cancel after price increases. The model is especially useful when platforms have strong measurement and advertiser relationships.
Live OTT TV is gaining relevance through sports, news and event programming. Live content supports appointment viewing and higher engagement. ESPN’s direct streaming service is a major example because it gives fans direct access to full ESPN networks through an enhanced digital interface. Live streaming can improve platform stickiness but requires strong technical reliability because outages during major events can harm brand trust.
DTC SVOD As A Control Point
DTC SVOD gives platforms control over pricing, data, interface and customer relationship. Direct access allows better personalization and lower reliance on distributors. Netflix, Disney+, Prime Video and Apple TV+ all use direct models to shape experience and collect first-party signals. Direct models also support faster product changes such as ad-tier launches, password controls and bundle testing.
The drawback is acquisition cost. Winning a direct subscriber requires marketing spend, content investment and retention tools. Smaller services may struggle to compete for attention. A direct model works best when the platform has strong brand pull, exclusive content or a highly focused audience. Without differentiation, direct distribution can become expensive and unstable.
Mobile-only plans are useful in price-sensitive markets. They reduce entry cost and fit viewing behavior in countries where smartphones are the primary screen. Mobile-only SVOD can expand reach but may limit ARPU. Platforms must decide whether mobile plans are a stepping stone into broader household subscriptions or a separate long-term product for lower-income users.
Local Language Content As A Retention Engine
Local language programming is one of the strongest retention tools. Viewers may sample global hits but often stay for content that reflects their language, humor, family context and social reality. India shows this clearly because regional language consumption is central to market depth. Similar patterns exist in South Korea, Japan, Turkiye, the Gulf and parts of Europe.
Local and regional platforms can defend market share by understanding culture better than global services. They often have stronger relationships with domestic producers, broadcasters, telecom operators and advertisers. Global services can compete by investing in local originals but they must avoid shallow localization. Audiences notice when content feels imported rather than rooted in local storytelling.
Sports SVOD is another strong content focus. Sports can support premium pricing and reduce churn during seasons. DAZN, ESPN and regional sports platforms show how rights can create loyal viewing behavior. High rights cost means sports services need careful packaging with highlights, documentaries, statistics, betting-adjacent experiences where legal and community features.
Market Segmentation
- By OTT Video Revenue Model
- SVOD (Subscription Video On Demand)
- AVOD (Advertising Supported OTT Video)
- EST (Electronic Sell Through) OTT Video
- FAST (Free Ad Supported Streaming TV)
- Live OTT TV
- TVOD (Transactional OTT Video)
- By SVOD Commercial Access Model
- DTC (Direct To Consumer) SVOD
- Mobile Only SVOD
- Multi Service Bundle SVOD
- Pay TV Operator Add On SVOD
- Telco Bundled SVOD
- Third Party Aggregator Sold SVOD
- By SVOD Content Focus
- Entertainment and General SVOD
- Kids and Family SVOD
- Local Language SVOD
- Sports SVOD
- By SVOD Platform Origin
- International Platform SVOD
- Local and Regional Platform SVOD
- By Connectivity Indicator
- Fixed Broadband Subscriptions
- Internet Users
- Mobile Broadband Subscriptions
- 4G Coverage
- 5G Coverage
Geographical Penetration
North America OTT TV and Video Market Growth
The United States is home to the entire world’s streaming strategies. Such firms like Netflix, Disney, Amazon, Apple, Comcast, Roku, Fox, Warner Bros. Discovery, and Paramount Skydance dominate the industry from this region. The continent has the largest development of ads tier since advertisers are redirecting funds from linear TV to CTV inventory.
The U.S. market is becoming more consolidated around bundles and advertising. Disney’s integration of Hulu into Disney+ during 2026 is designed to simplify the user interface and strengthen engagement. ESPN’s direct streaming launch expands the sports streaming opportunity. Fox’s agreement to acquire Roku signals the rising value of connected TV distribution. Netflix’s ad-supported reach shows that even premium platforms now rely on hybrid monetization.
Canada has followed the trends of U.S. but still has its own pricing and rights strategies. The local broadcasters, telcos, and global providers all compete for household viewers with high broadband penetration. Mexico is more price-sensitive and mobile-oriented.
Europe OTT TV and Video Market Outlook
Europe is a complex but high-value region. The UK, Germany, France, Italy, Spain, the Nordics and Benelux countries have strong broadband and established streaming usage. At the same time public broadcasters, domestic platforms and pay TV operators keep competition local. Viewers expect strong national language content and reliable compliance with privacy expectations.
Ad-supported tiers are gaining traction because household budgets are under pressure. The UK has become an important test bed for hybrid monetization and FAST growth. Germany and France retain strong local broadcasting ecosystems which means global platforms must compete with trusted domestic services. Southern Europe remains sensitive to pricing and bundling. Nordic markets have high digital adoption but strong local content expectations.
Regulation matters more in Europe than in many markets. Data privacy, content rules, consumer protection and local production requirements affect product design. Platforms must manage consent, advertising targeting and audience measurement carefully. Strong regional performance will come from services that combine global scale with local execution rather than treating Europe as one uniform market.
Asia-Pacific OTT TV and Video Market Analysis
Asia-Pacific offers the largest audience expansion opportunity. India, China, Japan, South Korea, Australia, Indonesia, Thailand, Vietnam, Malaysia, Singapore, Taiwan and Hong Kong represent very different commercial environments. Mobile viewing is dominant in many countries while connected TV is accelerating in higher-income urban households. Local content and pricing flexibility are central to success.
India is one of the most important growth markets because online video reach is large and connected TV adoption is rising quickly. Regional language content is a major driver. Paid conversion remains challenging because many users have access to free video and low-cost mobile data. Services that combine affordable plans, cricket or sports rights, local originals and telecom payment support have better prospects.
Japan and South Korea are high-value markets where domestic content and strong broadband support premium positioning. Japan has a mature entertainment culture and strong pay TV and broadcast habits. South Korea has global export strength in drama and music. Australia is closer to North American and UK viewing behavior with strong subscription adoption. Southeast Asia requires local partnerships and mobile-first pricing to scale.
South America OTT TV and Video Market Outlook
South America is growing through mobile broadband, younger audiences and strong demand for entertainment and sports. Brazil is the largest market and supports both international platforms and local media groups. Portuguese-language content is essential for retention. Football rights, telenovelas, reality formats and local comedy can drive engagement. Advertising-supported services have strong potential because household budgets are often constrained.
Argentina and Colombia offer meaningful growth but currency pressure, payment behavior and pricing sensitivity affect monetization. Platforms need flexible billing, local payment methods and partner bundles. Piracy and account sharing remain concerns. Services with free tiers or low-cost plans can convert some demand into legal viewing.
Regional competition is shaped by global services, local broadcasters, telecom platforms and sports rights owners. South America will reward services that localize pricing and content. A premium global catalog alone is not enough. Strong local marketing, device partnerships and payment convenience matter as much as content volume.
Middle East and Africa OTT TV and Video Market Outlook
In Middle East & Africa, there are both high-income Gulf countries as well as lower-income mobile first countries in Africa. Saudi Arabia, UAE, Qatar, Kuwait, Bahrain, and Oman all offer a highly desirable audience of premium international content, Arabic content, sports, and family entertainment. Telecom bundling is vital here, as telecom providers are good at billing.
South Africa is still the most prominent streaming country in Africa owing to its past with pay TV, passion for sports, and adoption of broadband technology. In Nigeria, Kenya, and Morocco, there are increasing numbers of mobile video viewers but there is still a need for monetization. Locally produced content, cheap mobile plans, and low data streaming solutions are needed.
Turkiye and Israel add further diversity. Turkiye has strong domestic drama production and export potential. Israel has advanced digital adoption and local content strength. Middle East and Africa overall require regional nuance. A platform that works in Dubai may not work in Lagos or Casablanca. Commercial success depends on payment design, language, data cost, family viewing habits and telco relationships.
Competitive Landscape
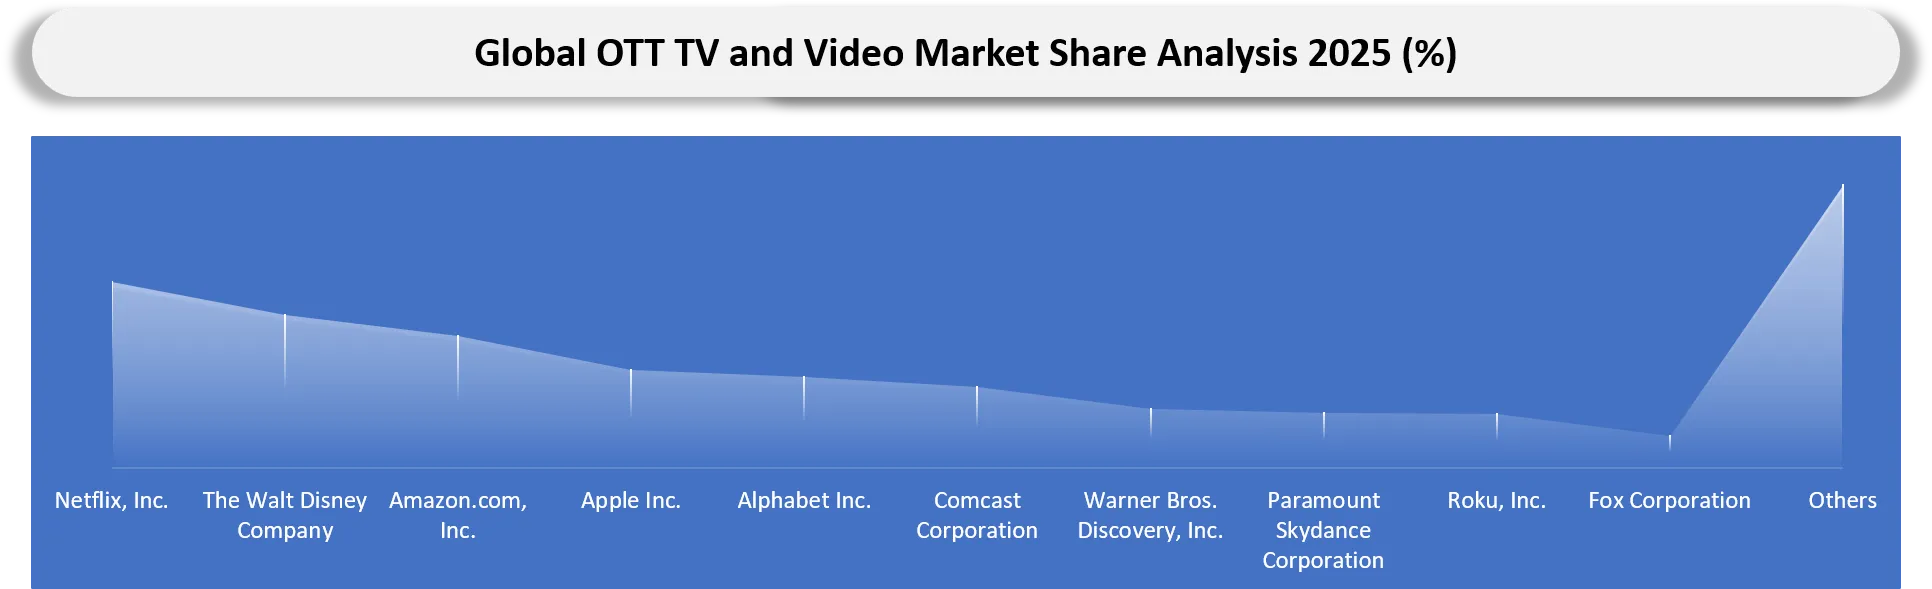
Competition is split between global subscription platforms, connected TV operating systems, local media groups, sports-led services, telecom bundles and free ad-supported services. Netflix, Disney, Amazon, Apple and YouTube operate with global reach. Roku, Samsung, Amazon and Google influence connected TV discovery. Regional players such as CANAL+, ITV, MultiChoice, Zee, Reliance, Tencent and iQIYI defend markets through local content and distribution relationships.
Competitive advantage is becoming multi-layered. Content remains important but does not guarantee retention. Pricing, discovery, advertising yield, payment convenience and bundle access can decide performance. Platforms that control both content and distribution have stronger leverage. Fox’s Roku agreement reflects this broader shift toward combining media assets with connected TV platform control.
The strongest competitive positions will combine brand trust, useful personalization, local relevance and monetization depth. Global services must keep investing in regional content while improving ad products. Local platforms must modernize user experience and measurement. Telecom operators and pay TV companies will remain important because they can simplify access and reduce churn through bundles.
Company List
- Netflix, Inc.
- The Walt Disney Company
- Amazon.com, Inc.
- Apple Inc.
- Alphabet Inc.
- Comcast Corporation
- Warner Bros. Discovery, Inc.
- Paramount Skydance Corporation
- Roku, Inc.
- Fox Corporation
- DAZN Group Limited
- Tencent Holdings Limited
- iQIYI, Inc.
- Alibaba Group Holding Limited
- Zee Entertainment Enterprises Limited
- Reliance Industries Limited
- Sony Group Corporation
- CANAL+ S.A.
- ITV plc
- MultiChoice Group Ltd.
Company Coverage Preview
Netflix, Inc. remains one of the most important global companies in streaming because it combines scale, original programming, international localization and increasingly important advertising capability. The company built its position by investing early in direct distribution, recommendation systems and country-level content. Its move into ad-supported plans has changed the growth story by giving price-sensitive households a lower entry path while creating a premium inventory base for advertisers.
Netflix’s advantage comes from global brand recognition, product consistency and a large engagement base. The company can launch original content across many countries and use viewing data to refine programming decisions. Its advertising business is still developing compared with older television ad sellers but the scale of the ad-supported tier gives it strong long-term potential. The company’s ability to balance paid growth, ad monetization and content cost will remain central to its competitive position.
The competitive challenge for Netflix is that large rivals now control strong ecosystems. Amazon links Prime Video to retail media and commerce. Disney connects Disney+, Hulu and ESPN assets. YouTube dominates creator-led video on connected TV. Roku and smart TV operating systems influence discovery. Netflix remains a benchmark platform but future growth will depend on how well it raises household revenue without weakening engagement.
Major Pain Points
- Content cost inflation makes it harder to protect margins while keeping libraries fresh.
- Subscription fatigue pushes households to rotate services and downgrade to ad-supported tiers.
- Password sharing controls can raise paid conversion but risk consumer backlash.
- Connected TV home-screen placement is costly and increasingly strategic.
- Sports rights bring strong engagement but create high fixed costs and seasonal churn.
- Regional localization requires dubbing, subtitling, metadata and cultural review at scale.
- Ad-supported streaming needs strong frequency controls to avoid viewer frustration.
- Piracy remains a major pressure in price-sensitive and mobile-first countries.
- Telco and aggregator partnerships can reduce acquisition cost but dilute direct customer ownership.
- Fragmented measurement makes advertisers compare OTT inventory cautiously.
Analyst View and Opinion
- The market is shifting from subscriber growth storytelling to disciplined monetization across SVOD, AVOD, FAST and live OTT TV.
- Advertising supported plans will become a standard part of premium streaming rather than a discount-only product.
- FAST growth will be strongest where connected TV discovery and free content libraries work together.
- Telco bundled SVOD will remain a practical route for emerging market expansion because billing and payment friction are lower.
- Sports SVOD will generate premium ARPU but only platforms with strong balance sheets can carry major rights costs safely.
- Local language content will decide retention in Asia-Pacific, the Middle East, South America and parts of Europe.
- Connected TV operating systems will gain negotiating power as home-screen discovery becomes more valuable.
- Platforms with clean advertising measurement and first-party data will capture stronger brand budgets.
- Generative AI will help localization and content operations but will not replace brand-led content strategy.
- Regional winners will combine affordable access, cultural fit, partner distribution and disciplined content spending.
Target Audience
| Industry | Who Should Buy This Report? | Reason To Buy This Report |
| OTT Platforms | Strategy Teams, Product Leaders, Pricing Teams | Evaluate OTT Video Revenue Model growth, access models and regional expansion opportunities |
| Broadcasters and Studios | Distribution Leaders, Content Teams, Partnership Teams | Assess direct streaming, FAST channel and licensing strategies |
| Telecom Operators | Consumer Business Teams, Bundle Managers, Digital Product Teams | Identify SVOD bundle opportunities and streaming-driven churn reduction models |
| Connected TV Platforms | Platform Strategy Teams, Advertising Teams | Understand home-screen discovery, FAST growth and advertising monetization |
| Advertisers and Agencies | Media Buyers, CTV Planning Teams, Measurement Leaders | Compare ad-supported streaming inventory, audience quality and regional reach |
| Investors | Private Equity, Public Market Analysts, Media Funds | Track growth pockets, margin pressure and consolidation themes |
| Consulting Firms | Media Consultants, Digital Strategy Teams | Support market entry, partner mapping and competitive benchmarking |
| Technology Vendors | CDN, Ad-Tech, Analytics and AI Teams | Map demand for streaming infrastructure, ad decisioning and personalization tools |
What DataM Uniquely Provides
- DataM separates OTT TV and video demand by OTT Video Revenue Model, SVOD access model, content focus, platform origin, connectivity indicator and region.
- DataM connects subscription and advertising economics instead of treating streaming only as a paid user market.
- DataM evaluates FAST, AVOD, live OTT TV, TVOD and EST alongside core SVOD revenue and subscription indicators.
- DataM maps telco bundled, pay TV add on, mobile only and third party aggregator sold SVOD models to practical customer acquisition routes.
- DataM benchmarks global and regional platforms together so clients can compare scale advantages against local language strength.
- DataM includes connectivity indicators such as fixed broadband, mobile broadband, internet users, 4G coverage and 5G coverage to support country-level sizing logic.
- DataM supports pricing discussions by separating ARPU, revenue per OTT household and customer access models.
- DataM helps clients identify where bundles, advertising tiers, sports rights and local language content can improve market entry or retention.