


2026 Energy Cost, Large-Load Tariff Exposure and Speed-to-Power
A state-by-state baseline for data centers, advanced manufacturing and other 50 MW loads.
| KEY TREND | At 50 MW, the energy-only annual cost ranges from about $22.3M in New Mexico to $172.3M in Hawaii before demand, capacity, collateral, CIAC and network-upgrade charges. |
| MARKET OUTLOOK | Low-cost states are not automatically fast-to-power states. Large-load tariffs, transmission capacity, substation availability and 60-75 MVA transformer lead times can dominate the project schedule. |
| RECOMMENDED FOR | Data centers, advanced manufacturing, battery plants, utilities, EPCs, site-selection teams and electrical-equipment suppliers |
Turn Market Signals into Business Opportunities
Explore equipment-level intelligence to support procurement planning, supplier evaluation and strategic market expansion: https://www.datamintelligence.com/electroiq#demo
DMI Analyst View
- The first number a 50 MW buyer should know is the energy baseline. At 100% load factor, a 50 MW facility consumes 438 GWh per year. Using the U.S. Energy Information Administration's August 2026 industrial electricity prices, that translates to roughly $22.3 million per year in New Mexico, $26.7 million in Louisiana and $31.6 million in Texas, versus $105.6 million in California and $172.3 million in Hawaii. Those figures are energy-only baselines, not utility quotes.
- The second number is the grid commitment. A 50 MW request increasingly sits inside special large-load rules. Berkeley Lab's 2026 review examined 55 tariffs and found thresholds from 0.3 MW to 150 MW, with a median threshold of 25 MW. At that point the buyer can face minimum bills, multi-year terms, collateral, exit charges and direct responsibility for upgrades.
- The third number is the energization date. In June 2026, FERC ordered all six regional grid operators under its jurisdiction to justify or reform their large-load connection rules. The action reflects the core problem: large-load growth is now moving faster than many existing interconnection processes, generation plans and transmission buildouts.
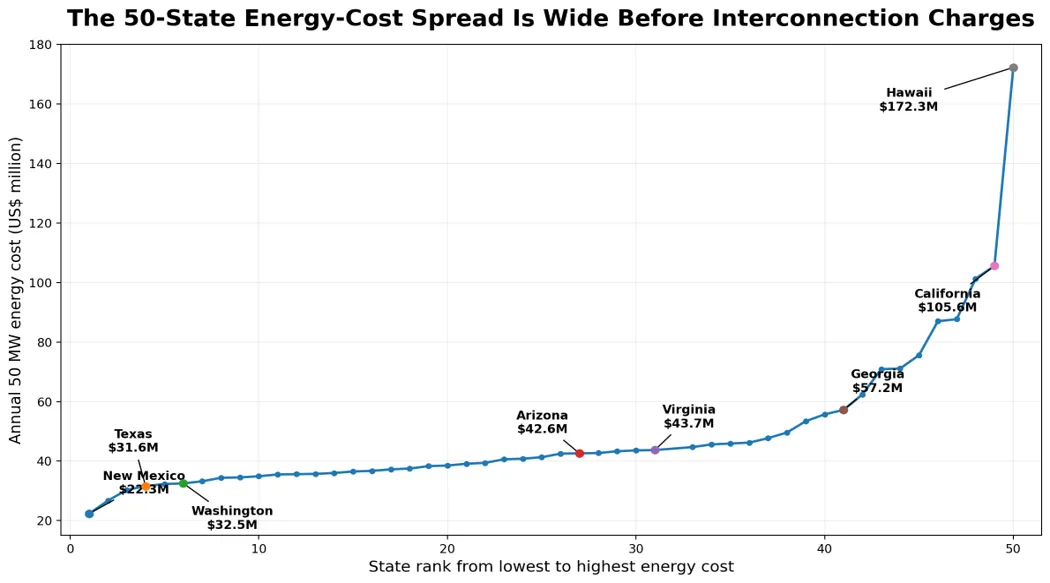
Source: U.S. EIA, August 2026 industrial electricity price data. Annual cost assumes 50 MW operating continuously for 8,760 hours.
The 50 MW Baseline: One Load, 50 Very Different Energy Bills
A continuously loaded 50 MW site consumes 438,000 MWh per year. At an 80% load factor, consumption falls to 350,400 MWh. The table below applies the same load to every state using EIA’s August 2026 average industrial electricity price. This creates a consistent benchmark before utility-specific demand charges, capacity charges, taxes, transmission riders, minimum bills and interconnection costs are added.
| Rank | State | Industrial rate | 50 MW annual cost | 50 MW annual cost |
| 垄/kWh | 100% LF ($M) | 80% LF ($M) | ||
| 1 | New Mexico | 5.08 | 22.3 | 17.8 |
| 2 | Louisiana | 6.1 | 26.7 | 21.4 |
| 3 | Tennessee | 6.92 | 30.3 | 24.2 |
| 4 | Texas | 7.21 | 31.6 | 25.3 |
| 5 | Kentucky | 7.37 | 32.3 | 25.8 |
| 6 | Washington | 7.43 | 32.5 | 26 |
| 7 | Mississippi | 7.57 | 33.2 | 26.5 |
| 8 | Arkansas | 7.85 | 34.4 | 27.5 |
| 9 | South Carolina | 7.88 | 34.5 | 27.6 |
| 10 | Montana | 7.97 | 34.9 | 27.9 |
| 11 | Alabama | 8.11 | 35.5 | 28.4 |
| 12 | North Dakota | 8.12 | 35.6 | 28.5 |
| 13 | Oklahoma | 8.16 | 35.7 | 28.6 |
| 14 | North Carolina | 8.23 | 36 | 28.8 |
| 15 | West Virginia | 8.34 | 36.5 | 29.2 |
| 16 | Nebraska | 8.37 | 36.7 | 29.3 |
| 17 | Kansas | 8.49 | 37.2 | 29.7 |
| 18 | Utah | 8.56 | 37.5 | 30 |
| 19 | Oregon | 8.75 | 38.3 | 30.7 |
| 20 | Wyoming | 8.8 | 38.5 | 30.8 |
| 21 | Florida | 8.93 | 39.1 | 31.3 |
| 22 | Michigan | 8.99 | 39.4 | 31.5 |
| 23 | Indiana | 9.28 | 40.6 | 32.5 |
| 24 | Iowa | 9.31 | 40.8 | 32.6 |
| 25 | South Dakota | 9.43 | 41.3 | 33 |
| 26 | Idaho | 9.71 | 42.5 | 34 |
| 27 | Arizona | 9.73 | 42.6 | 34.1 |
| 28 | Ohio | 9.75 | 42.7 | 34.2 |
| 29 | Missouri | 9.89 | 43.3 | 34.7 |
| 30 | Minnesota | 9.96 | 43.6 | 34.9 |
| 31 | Virginia | 9.98 | 43.7 | 35 |
| 31 | Colorado | 9.98 | 43.7 | 35 |
| 33 | Nevada | 10.2 | 44.7 | 35.7 |
| 34 | Delaware | 10.4 | 45.6 | 36.4 |
| 35 | Pennsylvania | 10.47 | 45.9 | 36.7 |
| 36 | New York | 10.54 | 46.2 | 36.9 |
| 37 | Wisconsin | 10.88 | 47.7 | 38.1 |
| 38 | Illinois | 11.33 | 49.6 | 39.7 |
| 39 | Maryland | 12.19 | 53.4 | 42.7 |
| 40 | Vermont | 12.72 | 55.7 | 44.6 |
| 41 | Georgia | 13.05 | 57.2 | 45.7 |
| 42 | Maine | 14.24 | 62.4 | 49.9 |
| 43 | Connecticut | 16.18 | 70.9 | 56.7 |
| 44 | New Jersey | 16.24 | 71.1 | 56.9 |
| 45 | New Hampshire | 17.26 | 75.6 | 60.5 |
| 46 | Rhode Island | 19.87 | 87 | 69.6 |
| 47 | Massachusetts | 20.03 | 87.7 | 70.2 |
| 48 | Alaska | 23.13 | 101.3 | 81 |
| 49 | California | 24.12 | 105.6 | 84.5 |
| 50 | Hawaii | 39.33 | 172.3 | 137.8 |
Data source: U.S. EIA Electric Power Monthly, Table 5.6.A, August 2026.
Methodology: 2026 values are preliminary EIA estimates. Costs above exclude utility demand and capacity charges, taxes, standby charges, minimum bills, interconnection studies, CIAC and network upgrades.
The Lowest-Cost States Are Concentrated in the South, Southwest and Interior West
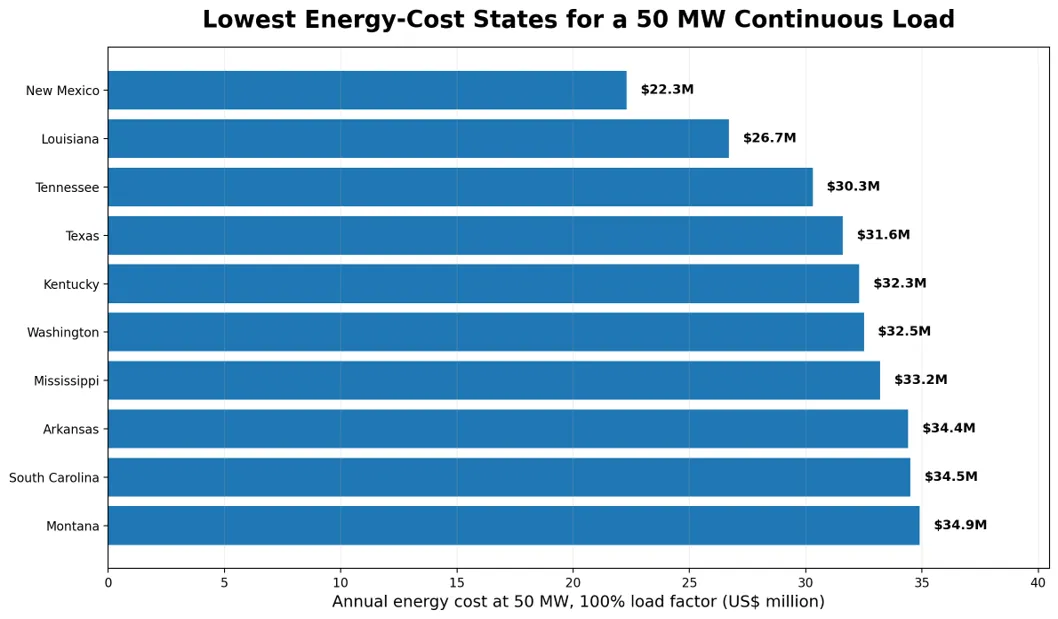
New Mexico is the lowest energy-cost state in the August 2026 EIA snapshot at 5.08¢/kWh, followed by Louisiana at 6.10¢, Tennessee at 6.92¢ and Texas at 7.21¢. For a 50 MW site running continuously, the gap between New Mexico and Texas is about $9.3 million per year. That is large enough to influence site selection before any tax incentive or real-estate difference is considered.
Explore ElectroIQ Intelligence
Discover how ElectroIQ helps you track electrical equipment demand, monitor lead times and identify emerging market opportunities: https://www.datamintelligence.com/electroiq#demo
High-Cost States Can Add More Than $100 Million per Year Before Grid Upgrades
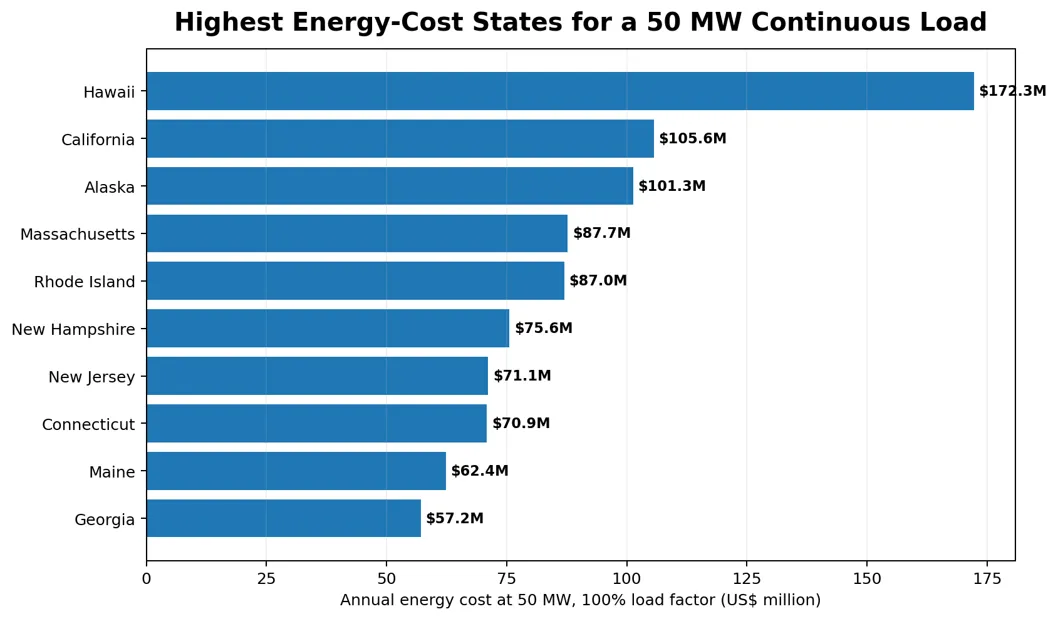
Hawaii, California and Alaska sit at the top of the statewide industrial-rate ranking. Massachusetts, Rhode Island, New Hampshire, New Jersey and Connecticut also carry materially higher energy costs than the national industrial average. For a load this large, a difference of 10¢/kWh equates to $43.8 million per year at full load.
Why the Statewide Energy Price Is Only the First Filter
Large-load tariff design is moving toward longer commitments and stronger customer security. Berkeley Lab’s 2026 update found that utilities are increasingly using minimum demand or bill provisions, contract terms, collateral, exit fees and customer-funded infrastructure to reduce the risk that other customers pay for stranded large-load investments.
| State | Large-load trigger / framework | What changes for a 50 MW buyer |
| Virginia | 25 MW+ GS-5 class | 14-year obligation, at least 85% of T&D costs and collateral safeguards for new large loads |
| Ohio | 25 MW+ Schedule DCT | Study fees of $10k-$100k, binding contract process, collateral equal to 50% of total minimum charges for customers not meeting credit tests |
| Georgia | 100 MW+ special treatment | PSC allows contract-specific terms and requires large users to cover site-specific and upstream generation, transmission and distribution costs |
| Oregon | Schedule 96 | Oregon PUC adopted a dedicated data-center service schedule and related large-customer rule changes in 2026 |
| Utah | 100 MW large-load framework | SB 132 created a large-scale service process and allows alternative generation arrangements when utility service requires major investment |
| Texas | 75 MW+ statutory regime | No immediate impact. Projects under 75 MW bypass the strict ERCOT "Batch Zero" review process, mandatory demand curtailment equipment, $100,000 upfront study fees, and the $50,000/MW financial security requirements. |
Sources: Virginia SCC, AEP Ohio , Oregon State Government, Georgia Public Service Commission, Utah Government Bill, Berkeley Lab 2026 large-load tariff update.
Speed-to-Power Is Becoming a Federal and Regional Grid Issue
On June 18, 2026, FERC launched a targeted action on large-load integration, directing the six jurisdictional regional grid operators to justify or reform how data centers, manufacturing plants and other large users connect. FERC separately emphasizes that state commissions still control retail rate design and many siting decisions, so a buyer can face both regional transmission rules and state/utility cost-recovery requirements. FERC explains that federal and state cost allocation responsibilities remain distinct.
For a 50 MW buyer, that means two sites with similar industrial electricity prices can have very different energization dates. One may connect through an existing high-voltage distribution substation with limited upgrades, while another may trigger a transmission-level project, new substation, network reinforcement or generation-adequacy concern.
The Utility Can Approve the Project Before the Equipment Exists
A 50 MW service at transmission or high-voltage distribution level typically depends on major substation equipment. The user-provided ElectroIQ Lead Time Tracker shows an average 160 weeks for large power transformers, 144 weeks for GSUs and 130 weeks for MV switchgear. That means a project that clears regulatory and interconnection gates can still miss its energization date if the transformer, switchgear or protection package was not reserved early enough.
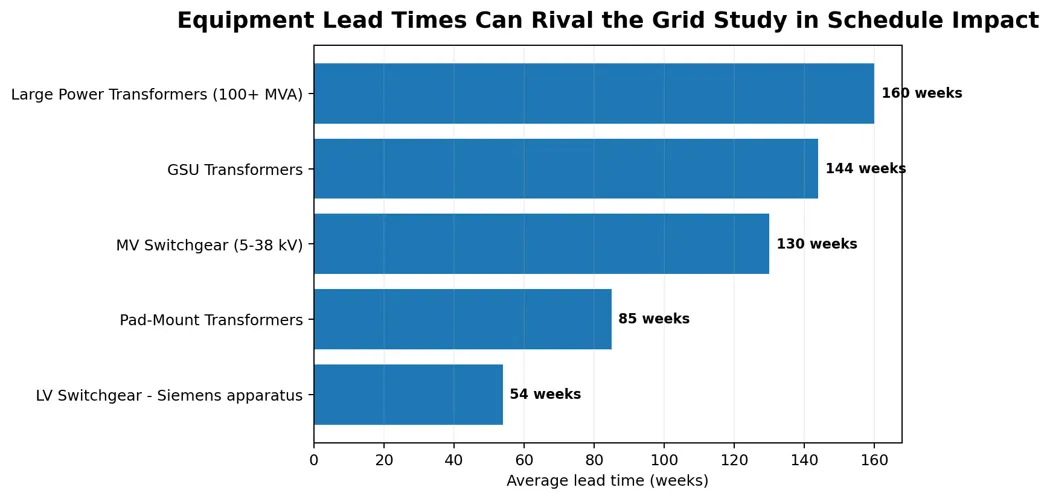
Source: ElectroIQ Lead Time Tracker
What a 50 MW Buyer Should Compare State by State
- Energy baseline. Use the EIA industrial rate to establish the first-pass operating cost. A 1¢/kWh difference is worth $4.38 million per year at a continuous 50 MW load.
- Large-load threshold. Determine whether 50 MW falls above or below the utility’s special tariff trigger. This can change the minimum bill, contract term, collateral and exit exposure.
- CIAC and network upgrade responsibility. Ask which substations, feeders, transmission upgrades and protection changes are customer-funded and whether unused facilities remain refundable or non-refundable.
- Realistic energization year. Request a utility-backed date tied to completed study milestones, land/site control and equipment procurement rather than a marketing estimate.
- Equipment reservation. Confirm the transformer MVA, voltage class, switchgear lineup and protection package needed to serve the load, then verify whether those factory slots are actually reserved.
- Flexibility value. Where tariffs permit curtailment, ramping or customer-supplied generation, quantify the value of reducing the utility’s firm capacity obligation during stressed hours.
Where ElectroIQ Fits
DataM Intelligence’s ElectroIQ can connect the state and utility screening process to the physical equipment schedule. The Lead Time Tracker identifies where transformer and switchgear availability is likely to break the utility energization plan, while the Project Tracker can prioritize large-load sites, data-center campuses, industrial plants and grid projects whose equipment packages are entering procurement.
For suppliers, the commercial opportunity is strongest where a project has power approval but lacks an executable equipment schedule. For buyers, the value is the reverse: identify the state/utility combination with the lowest total cost of power that can still meet the required COD, rather than selecting on headline electricity price alone.