Plant-Based Meat Market Size & Growth
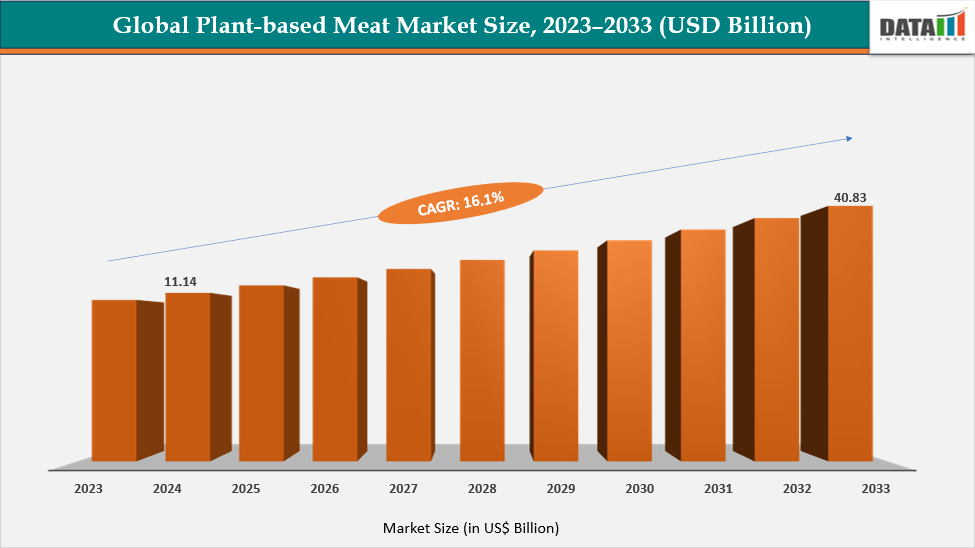
The global Plant-Based Meat Market reached US$ 12.66 billion in 2025 and is expected to reach US$ 40.83 billion by 2033, growing at a CAGR of 16.1% during the forecast period 2026-2033.
The market is expanding rapidly, driven by the increasing consumer shift toward sustainable, health-conscious, and ethical food choices. Rising awareness of the environmental impact of animal farming, coupled with growing concerns about animal welfare, is encouraging consumers to adopt plant-based alternatives.
Moreover, the rising incidence of lifestyle-related diseases such as obesity, diabetes, and cardiovascular disorders has accelerated the demand for high-protein, cholesterol-free meat substitutes. Food technology advancements have significantly improved the taste, texture, and nutritional profile of plant-based meat products, enhancing consumer acceptance. Additionally, investments from major food companies such as Nestlé, Tyson Foods, and Kellogg's are driving large-scale product launches and retail expansion.
The market growth is further supported by increasing flexitarian populations, government initiatives promoting sustainable food systems, and the expansion of vegan and vegetarian product lines across supermarkets, quick-service restaurants, and online platforms.
Recent Developments
- March 2026 – Beyond Meat and Impossible Foods pivot toward broader protein portfolios
Major players like Beyond Meat, Inc. and Impossible Foods Inc. are expanding into protein drinks, hybrid products, and minimally processed plant proteins, moving beyond traditional burger-style products. - March 2026 – Nestlé, Tyson Foods, and Maple Leaf Foods restructure plant-based divisions
Large food conglomerates such as Nestlé S.A. and Tyson Foods, Inc. are repositioning plant-based brands toward cost-competitive SKUs and foodservice channels, reflecting slower retail demand growth. - February 2026 – Consumer demand stabilizes but premium segment weakens
While flexitarian demand remains stable, premium plant-based meat sales have softened, as consumers perceive them as expensive compared to conventional meat alternatives. - February 2026 – Innovation shifts toward clean-label and minimally processed formulations
Companies are reformulating products to reduce additives, sodium, and processing complexity, addressing criticism that plant-based meats are highly ultra-processed. - January 2026 – Sensory parity with animal meat improves but remains inconsistent
Research shows plant-based products achieve near-parity in some categories like burgers and nuggets, but still lag in texture, juiciness, and flavor consistency across broader product types
Market Dynamics
Drivers: Rising Health and Environmental Awareness is significantly driving the Plant-Based Meat market growth
The increasing awareness of health and environmental issues is a major driving force behind the growth of the global plant-based meat market. From a health perspective, consumers are becoming more conscious of the risks associated with high consumption of animal meat, such as saturated fat, high cholesterol, cardiovascular disease, and certain cancers, and are turning toward alternatives that offer lower health risks. For instance, recent research indicates that over 68% of consumers consider health benefits, including reduced cholesterol and fat content, as key reasons for purchasing plant-based meat products.
From an environmental standpoint, there is growing recognition of the substantial ecological footprint of conventional livestock farming, which contributes significantly to greenhouse gas emissions, deforestation, land degradation, and water consumption. These concerns are motivating consumers to choose more sustainable protein sources.
Consumer acceptance of plant-based meat varies notably across age groups, income levels, and awareness levels. Sensory attributes such as taste, texture, and aroma remain crucial determinants of acceptance. However, some consumers remain dissatisfied with the mouthfeel and flavor, especially in products derived from extruded soy or legume proteins, which are sometimes perceived as less palatable. Pricing also plays a key role in shaping purchase decisions, particularly in price-sensitive markets.
Among non-vegetarian consumers, rising health concerns, including obesity and cardiovascular diseases, are prompting a gradual shift toward plant-based alternatives. At the same time, environmental consciousness and animal welfare awareness are gaining momentum, particularly among younger demographics. Vegetarians and vegans actively promote plant-based diets as a way to uphold ethical values and often influence others to adopt similar habits.
Overall, the convergence of health, ethical, and environmental motivations continues to strengthen consumer demand for plant-based meat, positioning it as a sustainable and responsible alternative to traditional meat consumption.
Restraints: High Product Costs and Limited Availability are hampering the growth of the market
High product costs and limited availability remain key factors restraining the growth of the global plant-based meat market. Compared to conventional meat, plant-based alternatives are often priced 30–50% higher, primarily due to the high cost of raw materials, specialized processing technologies, and limited economies of scale. For example, a single Beyond Burger patty can retail for around US$2–3, whereas a comparable beef patty typically costs less than US$1 in many markets. Similarly, the premium positioning of brands such as Impossible Foods or Nestlé’s Garden Gourmet products makes them less accessible to price-sensitive consumers in developing regions.
In addition to pricing challenges, limited product availability, especially outside urban centers and developed markets, continues to hinder wider adoption. Many consumers in emerging economies face restricted access due to inadequate distribution networks and fewer plant-based options in mainstream retail or foodservice outlets.
Overall, while growing consumer interest and technological advancements are gradually reducing production costs, price parity and wider accessibility remain essential for accelerating the mass adoption of plant-based meat products worldwide.
For more details on this report – Request for Sample
Plant-Based Meat Market, Segmentation Analysis
The global Plant-Based Meat market is segmented based on source, by product, by meat type, by end-user, and by region.
Soy protein isolates and concentrates possess excellent emulsifying, water-holding, and gel-forming properties, which enhance the texture, juiciness, and mouthfeel of plant-based meat products such as burgers, sausages, and nuggets. Major manufacturers, including Beyond Meat, Kellogg’s MorningStar Farms, and Conagra’s Gardein, continue to use soy as a key ingredient due to its availability and proven consumer acceptance.
Furthermore, soy-based meat alternatives benefit from established global supply chains, wide raw material availability, and lower production costs compared to newer protein sources such as pea, quinoa, or oat protein. Despite growing interest in alternative sources, soy remains the dominant choice for large-scale production, especially in Asia-Pacific and North America, where soy cultivation and processing infrastructure are well developed.
Overall, the soybeans segment maintains its leadership position due to its nutritional advantages, functional properties, and cost efficiency, making it the backbone of the plant-based meat industry.
The Others segment is the fastest-growing in the Plant-Based Meat market
The Others segment, led by pea protein, is the fastest-growing area of the global plant-based meat market. The rapid growth of this segment is primarily driven by rising consumer demand for non-allergenic, non-GMO, and clean-label protein sources. Pea protein has emerged as a preferred alternative to soy and wheat proteins due to its neutral taste, high digestibility, and suitability for consumers with soy or gluten allergies.
In addition, pea protein offers a balanced amino acid profile and excellent emulsifying and gel-forming properties, which help manufacturers replicate the fibrous, juicy texture of traditional meat. Leading companies such as Beyond Meat, Nestlé, and Tyson Foods have increasingly adopted pea protein as a core ingredient in their product formulations, further accelerating market expansion.
The segment’s growth is also supported by advancements in processing technology, which enhance the flavor, texture, and color of pea-based meat products, making them more appealing to mainstream consumers. Moreover, the increasing popularity of clean-label and sustainable food products, coupled with the growing number of flexitarian and health-conscious consumers, continues to boost demand.
Overall, the Others (Pea Protein) segment is gaining momentum as consumers and manufacturers alike seek sustainable, allergen-free, and high-performance protein alternatives, positioning it as the most dynamic and rapidly expanding category within the plant-based meat market.
Plant-Based Meat Market, Geographical Analysis
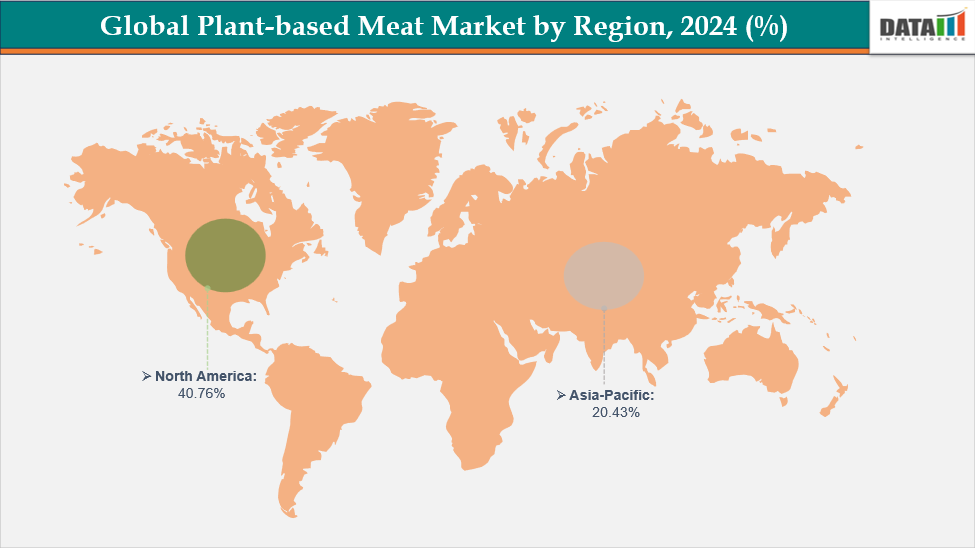
North America is expected to dominate the global Plant-Based Meat market
North America stands as the dominant region in the global plant-based meat market, driven by the strong presence of leading industry players such as Beyond Meat, Impossible Foods, Kellogg’s MorningStar Farms, Conagra’s Gardein, and Maple Leaf Foods. The region benefits from a highly developed food innovation ecosystem, strong R&D investments, and a growing base of health-conscious and environmentally aware consumers.
The increasing prevalence of vegan, vegetarian, and flexitarian diets has significantly boosted demand across the U.S. and Canada. Additionally, major foodservice chains, including McDonald’s, Burger King, KFC, and Starbucks, have introduced plant-based menu options in collaboration with plant-based meat producers, further driving mainstream adoption.
The region’s advanced retail infrastructure, strong marketing support, and government initiatives promoting sustainable food systems also contribute to its leadership position. High purchasing power and increasing consumer willingness to pay a premium for healthier, sustainable products further strengthen the market’s growth trajectory.
Overall, North America’s dominance in the plant-based meat market is attributed to its innovative product development, robust distribution networks, and growing consumer preference for sustainable and health-focused diets, making it the global hub for plant-based meat innovation and consumption.
US Plant-Based Meat Market Trends
The U.S. plant-based meat market is witnessing dynamic growth, fueled by evolving consumer preferences, product innovation, and expanding retail and foodservice availability. The shift toward healthier, sustainable, and ethical eating habits is driving American consumers to increasingly adopt plant-based alternatives. Soy continues to dominate as a key ingredient; however, pea protein is emerging as the fastest-growing source, reflecting the rising demand for allergen-free, non-GMO, and clean-label products. The market is also diversifying in terms of product formats, with burgers leading sales while plant-based sausages, nuggets, and chicken-style alternatives are gaining rapid traction. Moreover, retail and foodservice expansion across major grocery chains and restaurant networks has made plant-based meat more accessible to mainstream consumers. U.S. consumers are also demanding clean-label and transparent products, with clear ingredient sourcing and minimal additives, aligning with the broader sustainability movement. Despite these advances, the sector faces challenges such as high prices compared to conventional meat, as well as consumer concerns about taste and texture.
The Asia Pacific region is the fastest-growing region in the global Plant-Based Meat market
The Asia-Pacific region is emerging as the fastest-growing market for plant-based meat, driven by a combination of rising health awareness, shifting dietary preferences, and strong innovation from both global and local brands. The region’s rapid population growth, increasing urbanization, and expanding middle-class demographic are leading to greater demand for nutritious, sustainable, and ethically produced food alternatives. Consumers in countries such as China, India, Japan, South Korea, and Australia are becoming more conscious of the health risks associated with excessive meat consumption, including obesity and heart disease, and are turning toward plant-based protein options as healthier substitutes.
In addition, environmental concerns related to livestock farming, such as high carbon emissions, land degradation, and water scarcity, are prompting governments and organizations to support sustainable food production initiatives. For example, China’s national dietary guidelines encourage reducing meat consumption by 50%, while Singapore and Japan have become innovation hubs for alternative protein startups and food tech companies. The growth of e-commerce platforms and retail expansion across the Asia Pacific has also improved accessibility and product visibility, allowing consumers to explore a wider range of plant-based meat options.
Moreover, major international players such as Beyond Meat, Impossible Foods, and Nestlé, along with regional innovators like Zhenmeat, OmniFoods, and v2food, are investing heavily in product development and localized flavors to cater to Asian palates. This localization strategy, combined with rising vegan and flexitarian populations, has significantly accelerated adoption. Overall, the Asia-Pacific region’s rapid growth is fueled by a blend of health awareness, sustainability efforts, government initiatives, and strong regional innovation, positioning it as the most dynamic and promising market for plant-based meat globally.
Europe Plant-Based Meat Market Trends
In Europe, the plant-based meat market is gaining strong momentum as consumers increasingly adopt flexitarian, vegetarian, and vegan diets and seek healthier, sustainable protein alternatives. Markets such as Germany, the UK, France, and the Netherlands are at the forefront of this shift, driven by heightened health awareness and concerns over the environmental impact of traditional livestock farming.
Plant-Based Meat Market Competitive Landscape
Top companies in the Plant-Based Meat market include Beyond Meat, Kellogg Company, Impossible Foods Inc., Maple Leaf Foods, Conagra Foods, Sunfed, Kraft Foods, Inc., Nestle, Tyson, WH Group, among others.
Market Scope
| Metrics | Details | |
| CAGR | 16.1% | |
| Market Size Available for Years | 2022-2033 | |
| Estimation Forecast Period | 2026-2033 | |
| Revenue Units | Value (US$ Bn) | |
| Segments Covered | Source | Soybeans, Wheat, Quinoa, Peanut, Oats, and Others |
| Product | Burgers, Sausages, Crumbles, Nuggets, Meatballs, Others | |
| Meat Type | Beef, Chicken, Pork, Fish | |
| End User | Retail, HORECA (Hotel, Restaurant, Cafe) | |
| Regions Covered | North America, Europe, Asia-Pacific, South America and the Middle East & Africa | |
The global Plant-Based Meat market report delivers a detailed analysis with 70 key tables, more than 68 visually impactful figures, and 159 pages of expert insights, providing a complete view of the market landscape.
Suggestions for Related Report
For more food and beverage-related reports, please click here