Global Geovisualization Market is segmented By Component (Hardware, Software, Services), By Deployment Model (Cloud, On-premise), By Application (Location Intelligence, Risk Management, Urban Planning, Environmental Management, Others), By End-User (Natural Resources, Security & Defense, BFSI, Media & Entertainment, Healthcare, Architecture, Engineering & Construction, Education, Others), and By Region (North America, South America, Europe, Asia Pacific, Middle East, and Africa) – Share, Size, Outlook, and Opportunity Analysis, 2024-2031.
Market Size
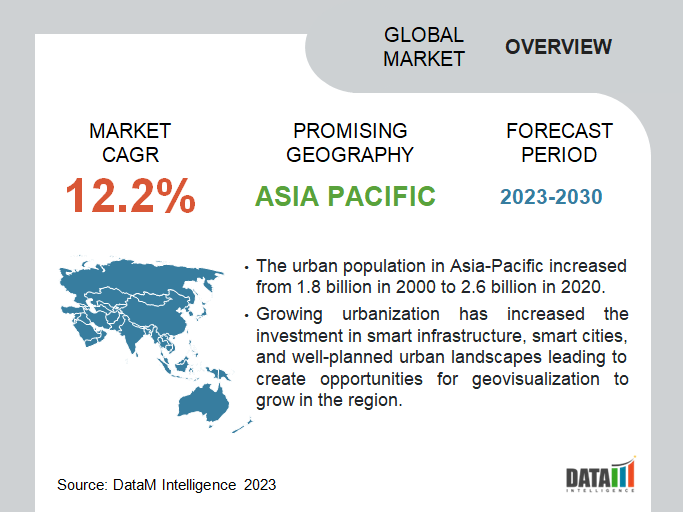
Global Geovisualization Market reached US$ 9.1 billion in 2022 and is expected to reach US$ 22.7 billion by 2031 growing with a CAGR of 12.2% during the forecast period 2024-2031.
The global geovisualization market is experiencing steady growth due to the increasing adoption of location-based services and advancements in data visualization technologies. As industries continue to recognize the value of geospatial data for decision-making, the demand for geovisualization tools and services is expected to continue expanding in the future.
North America holds the highest share in the global geovisualization market and is expected to cover more than 54.4% in the forecast period due to the presence of major geospatial technology companies, advancements in data visualization technologies, and the widespread adoption of geospatial applications in various industries. U.S., in particular, has a strong market for geovisualization, driven by the presence of key players and a thriving ecosystem of geospatial innovation.
Market Scope
|
Metrics |
Details |
|
CAGR |
12.2% |
|
Size Available for Years |
2021-2030 |
|
Forecast Period |
2024-2031 |
|
Data Availability |
Value (US$) |
|
Segments Covered |
Component, Deployment Model, Application, End-User and Region |
|
Regions Covered |
North America, Europe, Asia-Pacific, South America and Middle East & Africa |
|
Fastest Growing Region |
Asia-Pacific |
|
Largest Region |
North America |
|
Report Insights Covered |
Competitive Landscape Analysis, Company Profile Analysis, Market Size, Share, Growth, Demand, Recent Developments, Mergers and Acquisitions, New Equipment Type Launches, Growth Strategies, Revenue Analysis, Porter’s Analysis, Pricing Analysis, Regulatory Analysis, Supply-Chain Analysis and Other key Insights. |
For more details on this report - Request for Sample
Market Dynamics
Growing Demand For GIS Solutions Across Various Industries
Geovisualization plays a crucial role in GIS (Geographic Information System) solutions by visualizing geographic data. GIS solutions offer advanced data visualization capabilities, allowing users to present complex geospatial data in a visual format. Geovisualization techniques, such as interactive maps, 3D visualizations, and thematic representations, enhance the visual appeal and interpretability of the data. This capability is essential for effectively communicating spatial information to stakeholders, enabling better decision-making and analysis.
For instance, GIS technology is an essential component of smart cities because it allows for collecting, managing, and analyzing large amounts of data from various sources, including sensors, cameras, and other IoT devices. The collected data can then be used to create maps, visualizations, and other information products that help city officials and stakeholders make better-informed decisions.
Technological Advancements
Technological advancements have led to significant improvements in data visualization techniques and tools. Geovisualization has benefited from these advancements, enabling the creation of more immersive and interactive visual representations of geospatial data. Advanced mapping platforms, 3D visualization technologies, virtual reality (VR), and augmented reality (AR) applications have enhanced the visual appeal and interpretability of geospatial information, making it easier for users to explore and understand complex spatial relationships.
Companies are investing in adopting advanced technology. For instance, On April 5, 2022, Dataminr introduced new functionality integrated into Dataminr Pulse, its corporate-risk platform. Dataminr Pulse gathers early warning signs of developing security and market hazards from information that is readily available to the public and makes them instantly accessible. Enterprises can collaborate and manage crisis responses effectively with visual context due to its new sophisticated geovisualization and intuitive crisis response features.
High Cost of the Technology
Geovisualization has gained immense popularity recently; however, the high cost is the major reason challenging the technology's market growth. The high cost of the technology is due to various reasons such as the high cost of hardware, cost of software licensing, data cost, cost of technicians and maintenance cost. Out of all, hardware cost is among the major factors hurdling market growth. Furthermore, geovisualization technology often requires specialized hardware, such as high-end graphics cards and powerful computers, which can be expensive.
The cost of geovisualization technology can vary widely, depending on an organization's specific requirements. However, it is not uncommon for the total cost to be hundreds of thousands of dollars or even more.
Market Segmentation Analysis
The global geovisualization market is segmented based on component, deployment model, application, end-user and region.
Rising Natural Disasters, Environmental Hazards And Man-Made Events Across The Globe
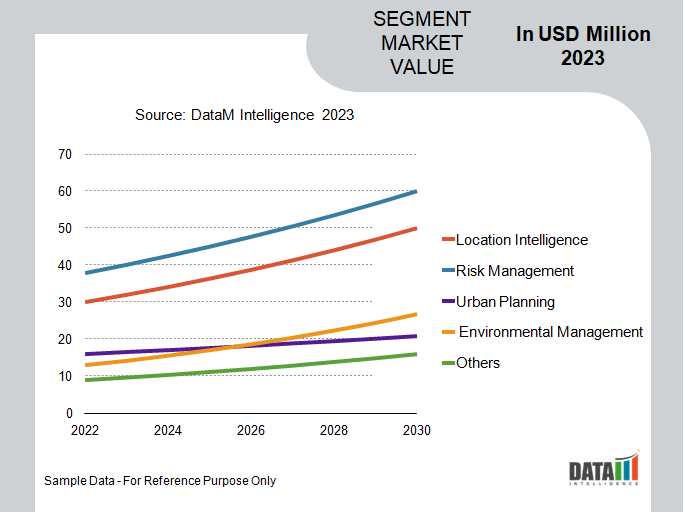
The global geovisualization market is segmented on application into location intelligence, risk management, urban planning, environmental management, and others. The risk management application segment is a key contributor to the growth of the global geovisualization market as it provides a visual representation of potential risks and hazards, enabling organizations to understand better and mitigate the impact of these risks. Risk management includes natural disasters, environmental hazards, and man-made events which make the segment cover nearly 1/4th share globally.
A natural disaster has increased since the past decade; for instance, in 2021, nearly 70 eruptions and 148 earthquakes with a magnitude of 6 or more were recorded globally. The growth in natural disasters is further expected to improve due to rising global warnings leading to create demand for technology. Geovisualization technology can clearly and concisely represent these risks' impact, helping organizations make informed decisions regarding risk mitigation strategies. For example, it can provide detailed maps showing flood zones, evacuation routes, and critical infrastructure. The information can be used to plan for and respond to disasters, reducing the impact on communities and businesses leading to escalating the segment’s growth.
Market Geographical Share
Asia-Pacific rules the market as a result of growing infrastructural investments and growing GIS technology in the region
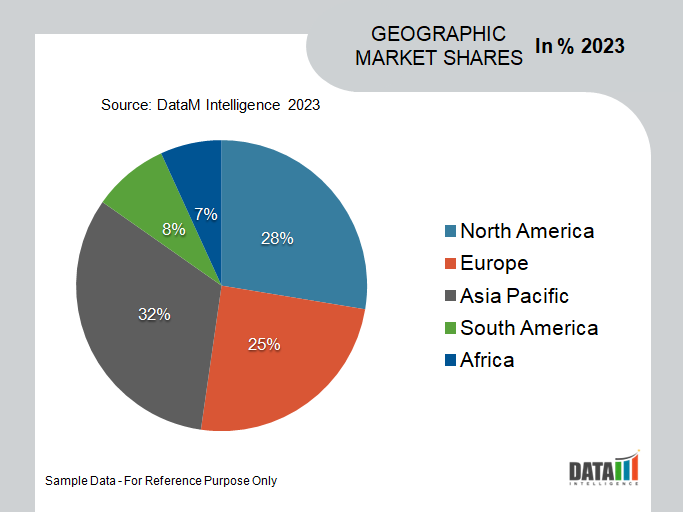
Asia-Pacific has seen significant growth in the geovisualzation market covering nearly more than 49.5% share due to rapid urban population growth and the country's growing economies, including India, China, and Indonesia. Furthermore, the above growth has generated a high demand for smart infrastructure, smart cities, and well-planned urban landscapes. China, India, South Korea, and Japan are at the forefront of developing 5G and IoT infrastructure, generating the demand for GIS technology and creating growth prospects for the geovisualization market.
For instance, the demand for Geographic Information Systems (GIS) in India has been increasing in recent years, driven by the country's growing need for efficient management of land and natural resources, as well as the need for better decision-making in various sectors such as urban planning, infrastructure development, and natural resource management.
Market Companies
The major global players include ESRI, Oracle Corporation, Alteryx, Inc, Fugro N.V., Hexagon AB, RMSI Pvt. Ltd, SAP SE, Trimble Inc, L3Harris Technologies, General Electric Company, TomTom N.V, Google LLC.
COVID-19 Impact On Geovisualization Market Growth
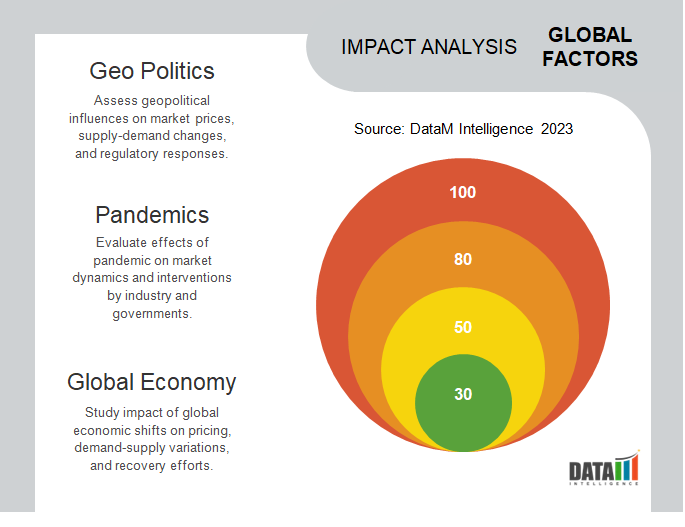
The COVID-19 pandemic has impacted the growth of geovisualization market. The global health crisis has accelerated the adoption and integration of geospatial technology in various fields, including public health, epidemiology, emergency management, and policymaking.
Geovisualization plays a crucial role in monitoring the spread of COVID-19 and in analyzing the pandemic's impact on communities and economies. It allows for the creation of interactive maps and dashboards, which provide real-time insights into the virus's progression and help decision-makers make informed decisions.
Russia-Ukraine War Impact
The Russia-Ukraine war has had significant impacts on various sectors, including the geovisualization market. The war's direct impact on the geovisualization market may not be immediately apparent, it has indirectly influenced the demand for geospatial information and technology through increased demand for real-time situational awareness, geospatial intelligence, humanitarian and crisis response, infrastructure assessment, and border and territorial disputes.
Furthermore, the conflict has also highlighted the importance of geospatial data and technology in understanding and managing the evolving geopolitical situation in the region. The conflict has led to increased defense and security investments in both Russia and Ukraine. These investments often include the development and acquisition of advanced geospatial technologies for intelligence, surveillance, and reconnaissance purposes.
AI Impact Analysis
Artificial intelligence (AI) has had a profound impact on the geovisualization market, revolutionizing the way geospatial data is analyzed, visualized, and utilized. Geospatial data is becoming more widely available due to AI, which also makes it simpler for non-experts to understand and utilize this data. Decision-makers who may not have a background in GIS can access complex geospatial data by turning it into simple, understandable visualisations using machine learning algorithms.
Additionally, the development of cloud-based GIS platforms has increased the accessibility of geospatial analysis powered by AI. With the help of these platforms, consumers can access advanced AI technologies without the expense of specialty knowledge or expensive hardware. Small businesses, NGOs, and even individuals now have new opportunities to take advantage of the potential of AI and GIS.
By Component
- Hardware
- Software
- Services
By Deployment Model
- Cloud
- On-premise
By Application
- Location Intelligence
- Risk Management
- Urban Planning
- Environmental Management
- Others
By End-User
- Natural Resources
- Security & Defense
- BFSI
- Media & Entertainment
- Healthcare
- Architecture, Engineering & Construction
- Education
- Others
By Region
- North America
- U.S.
- Canada
- Mexico
- Europe
- Germany
- UK
- France
- Italy
- Russia
- Rest of Europe
- South America
- Brazil
- Argentina
- Rest of South America
- Asia-Pacific
- China
- India
- Japan
- Australia
- Rest of Asia-Pacific
- Middle East and Africa
Key Developments
- In July 2021, Dataminr announced the acquisition of WatchKeeper, a company focused on real-time data geovisualization platforms for corporate enterprises.
- On April 5, 2022, Dataminr introduced new functionality integrated into Dataminr Pulse, its corporate-risk platform. Dataminr Pulse gathers early warning signs of developing security and market hazards from information that is readily available to the public and makes them instantly accessible. Enterprises can collaborate and manage crisis responses effectively with visual context due to its new sophisticated geovisualization and intuitive crisis response features.
- In 2021, Esri India, a growing Geographic Information System (GIS) solutions provider, announced the launch of its new technology Indo ArcGIS to address the need for ready-to-use GIS-based solutions and geospatial content for GIS users in India.
Why Purchase the Report?
- To visualize the global geovisualization market segmentation based on component, deployment model, application, end-user and region, as well as understand key commercial assets and players.
- Identify commercial opportunities by analyzing trends and co-development.
- Excel data sheet with numerous data points of geovisualization market-level with all segments.
- PDF report consists of a comprehensive analysis after exhaustive qualitative interviews and an in-depth study.
- Product mapping available as excel consisting of key products of all the major players.
The global geovisualization market report would provide approximately 69 tables, 73 figures and 200 Pages.
Target Audience 2023
- Manufacturers/ Buyers
- Industry Investors/Investment Bankers
- Research Professionals
- Emerging Companies